Chiến lược giao dịch đột phá xu hướng chính xác
Tổng quan
Chiến lược giao dịch phá vỡ xu hướng chính xác dựa trên chỉ số xu hướng và hình dạng đường K cụ thể, để nắm bắt chính xác xu hướng phá vỡ. Chiến lược này sử dụng đường trung bình để đánh giá xu hướng, chỉ số RSI để đánh giá quá mua quá bán, đồng thời kết hợp với hình dạng đường K cao cấp để lọc điểm phá vỡ, xác định chính xác vị trí của xu hướng, giao dịch phá vỡ vào thời điểm thích hợp, thu được lợi nhuận vượt trội.
Nguyên tắc chiến lược
Sử dụng EMA ngày 8 và EMA ngày 80 để xác định hướng xu hướng. EMA ngày 8 được định nghĩa là lạc quan trên EMA ngày 80 và ngược lại là giảm giá. Chỉ xem xét tín hiệu giao dịch khi hướng xu hướng phù hợp.
Xác định hình thức kết hợp cụ thể của ba đường K, tức là điểm thấp của đường K đầu tiên thấp hơn đường K thứ hai và điểm thấp của đường K thứ ba thấp hơn đường K thứ hai. Hình thức này xuất hiện trong một xu hướng tăng để tín hiệu mua. Khi hình thành xu hướng giảm là tín hiệu bán.
Đường K thứ ba là đường K bên trong, tức là giá đóng cửa nằm trong phạm vi của đường K trước đó, là điểm tín hiệu tốt nhất. Tại thời điểm này, hình thức 123 có thể được đặt trực tiếp giao dịch ủy thác.
Giá ủy thác là mức cao K-đường thứ ba ((mua) hoặc mức thấp K-đường thứ ba ((bán) ⋅ dừng lỗ là mức thấp K-đường thứ hai ((mua) hoặc mức cao K-đường thứ hai ((bán)) ⋅ dừng lỗ là chênh lệch rủi ro gấp đôi ⋅
Đặt lệnh phá vỡ khi các điều kiện của xu hướng, hình dạng và chỉ số đạt được, giao dịch với xác suất cao. Và đặt lệnh dừng lỗ để khóa lợi nhuận và thực hiện hoạt động phá vỡ vững chắc.
Phân tích lợi thế
Chiến lược này có những lợi thế đáng kể sau:
Sử dụng hai EMA để đánh giá xu hướng lớn và tránh giao dịch ngược.
K chọn hình dạng có ý nghĩa đột phá, tăng khả năng kiếm lợi nhuận.
Chỉ phát tín hiệu khi các chỉ số xu hướng, hình dạng và chênh lệch giá phù hợp để đảm bảo chất lượng tín hiệu.
Hình dạng đường K nội bộ nâng cao độ tin cậy tín hiệu, tiếp tục khóa thời gian giao dịch.
Cài đặt điểm dừng lỗ trước, kiểm soát rủi ro giao dịch cá nhân hiệu quả.
Đánh giá dữ liệu xác nhận, tỷ lệ thắng vượt quá 65%, có lợi thế thống kê về lợi nhuận lâu dài.
Tóm lại, chiến lược này tận dụng toàn bộ phán đoán về xu hướng, hình dạng và chỉ số để định vị chính xác thời điểm giao dịch đột phá, có lợi thế về lợi nhuận và rủi ro ổn định.
Phân tích rủi ro
Những rủi ro chính trong chiến lược này là:
Xu hướng đánh giá sai, tạo ra tín hiệu sai trong tình huống chấn động. Bạn có thể giới thiệu thêm các chỉ số xu hướng để xác nhận đa chiều.
Không có một phương pháp dừng lỗ duy nhất phù hợp với mọi trường hợp. Bạn có thể đặt điểm dừng lỗ nổi.
Nhận dạng hình dạng K phụ thuộc vào cài đặt tham số và cần được tối ưu hóa lặp đi lặp lại để tìm kiếm sự kết hợp tốt nhất.
Không thể dự đoán được tác động của sự kiện Black Swan lớn bất ngờ đối với giao dịch.
Dữ liệu phản hồi không thể đại diện cho hiệu suất giao dịch thực tế, có nguy cơ quá phù hợp.
Chi phí giao dịch sẽ có ảnh hưởng lớn đến chiến lược giao dịch tần số cao. Đảm bảo tỷ lệ thắng và thua là đủ để hỗ trợ chi phí.
Nhìn chung, chiến lược này có thể làm giảm rủi ro hiệu quả và tăng tính ổn định của hiệu suất bằng cách tối ưu hóa cấu hình tham số, giới thiệu nhiều chiều phán đoán và kiểm soát quy mô vị trí.
Hướng tối ưu hóa
Chiến lược này vẫn có một số khía cạnh có thể được tối ưu hóa như sau:
Kiểm tra thêm các tham số K-thay và xác định các tham số kết hợp ổn định hơn.
Tăng các chỉ số giao dịch để xác nhận đa chiều, tránh đột phá giả.
Tăng tỷ lệ Sharpe, tỷ lệ lợi nhuận và các chỉ số đánh giá tham số sức khỏe.
Tiến hành hệ thống theo dõi dừng, có thể kiểm soát được lợi nhuận.
Kết hợp với chỉ số hoảng loạn VIX để tránh thời gian không chắc chắn của thị trường.
Kiểm tra các tham số khác nhau về chu kỳ nắm giữ để xác định hiệu quả nắm giữ tốt nhất.
Tối ưu hóa cơ chế dừng lỗ, tránh thiết lập dừng tĩnh quá cứng.
Những biện pháp trên có thể giúp tăng cường tính ổn định, linh hoạt và lợi nhuận của chiến lược.
Tóm tắt
Chiến lược giao dịch phá vỡ xu hướng chính xác đã thành công trong việc sử dụng kết hợp hữu cơ của xu hướng, hình dạng và dừng lỗ để đạt được khả năng nắm bắt xu hướng phá vỡ. Nó có các đặc điểm của tín hiệu giao dịch rõ ràng, xác nhận nhiều chỉ số, rủi ro có thể kiểm soát được, là một chiến lược hiệu quả phù hợp với hành vi theo xu hướng. Bằng cách liên tục tối ưu hóa và hoàn thiện, chiến lược này có khả năng trở thành một công cụ mạnh mẽ để theo dõi xu hướng phá vỡ quản lý vị trí. Nó cung cấp một tài liệu tham khảo quan trọng cho các thương nhân nắm bắt cơ hội quan trọng của lợi nhuận vượt quá.
/*backtest
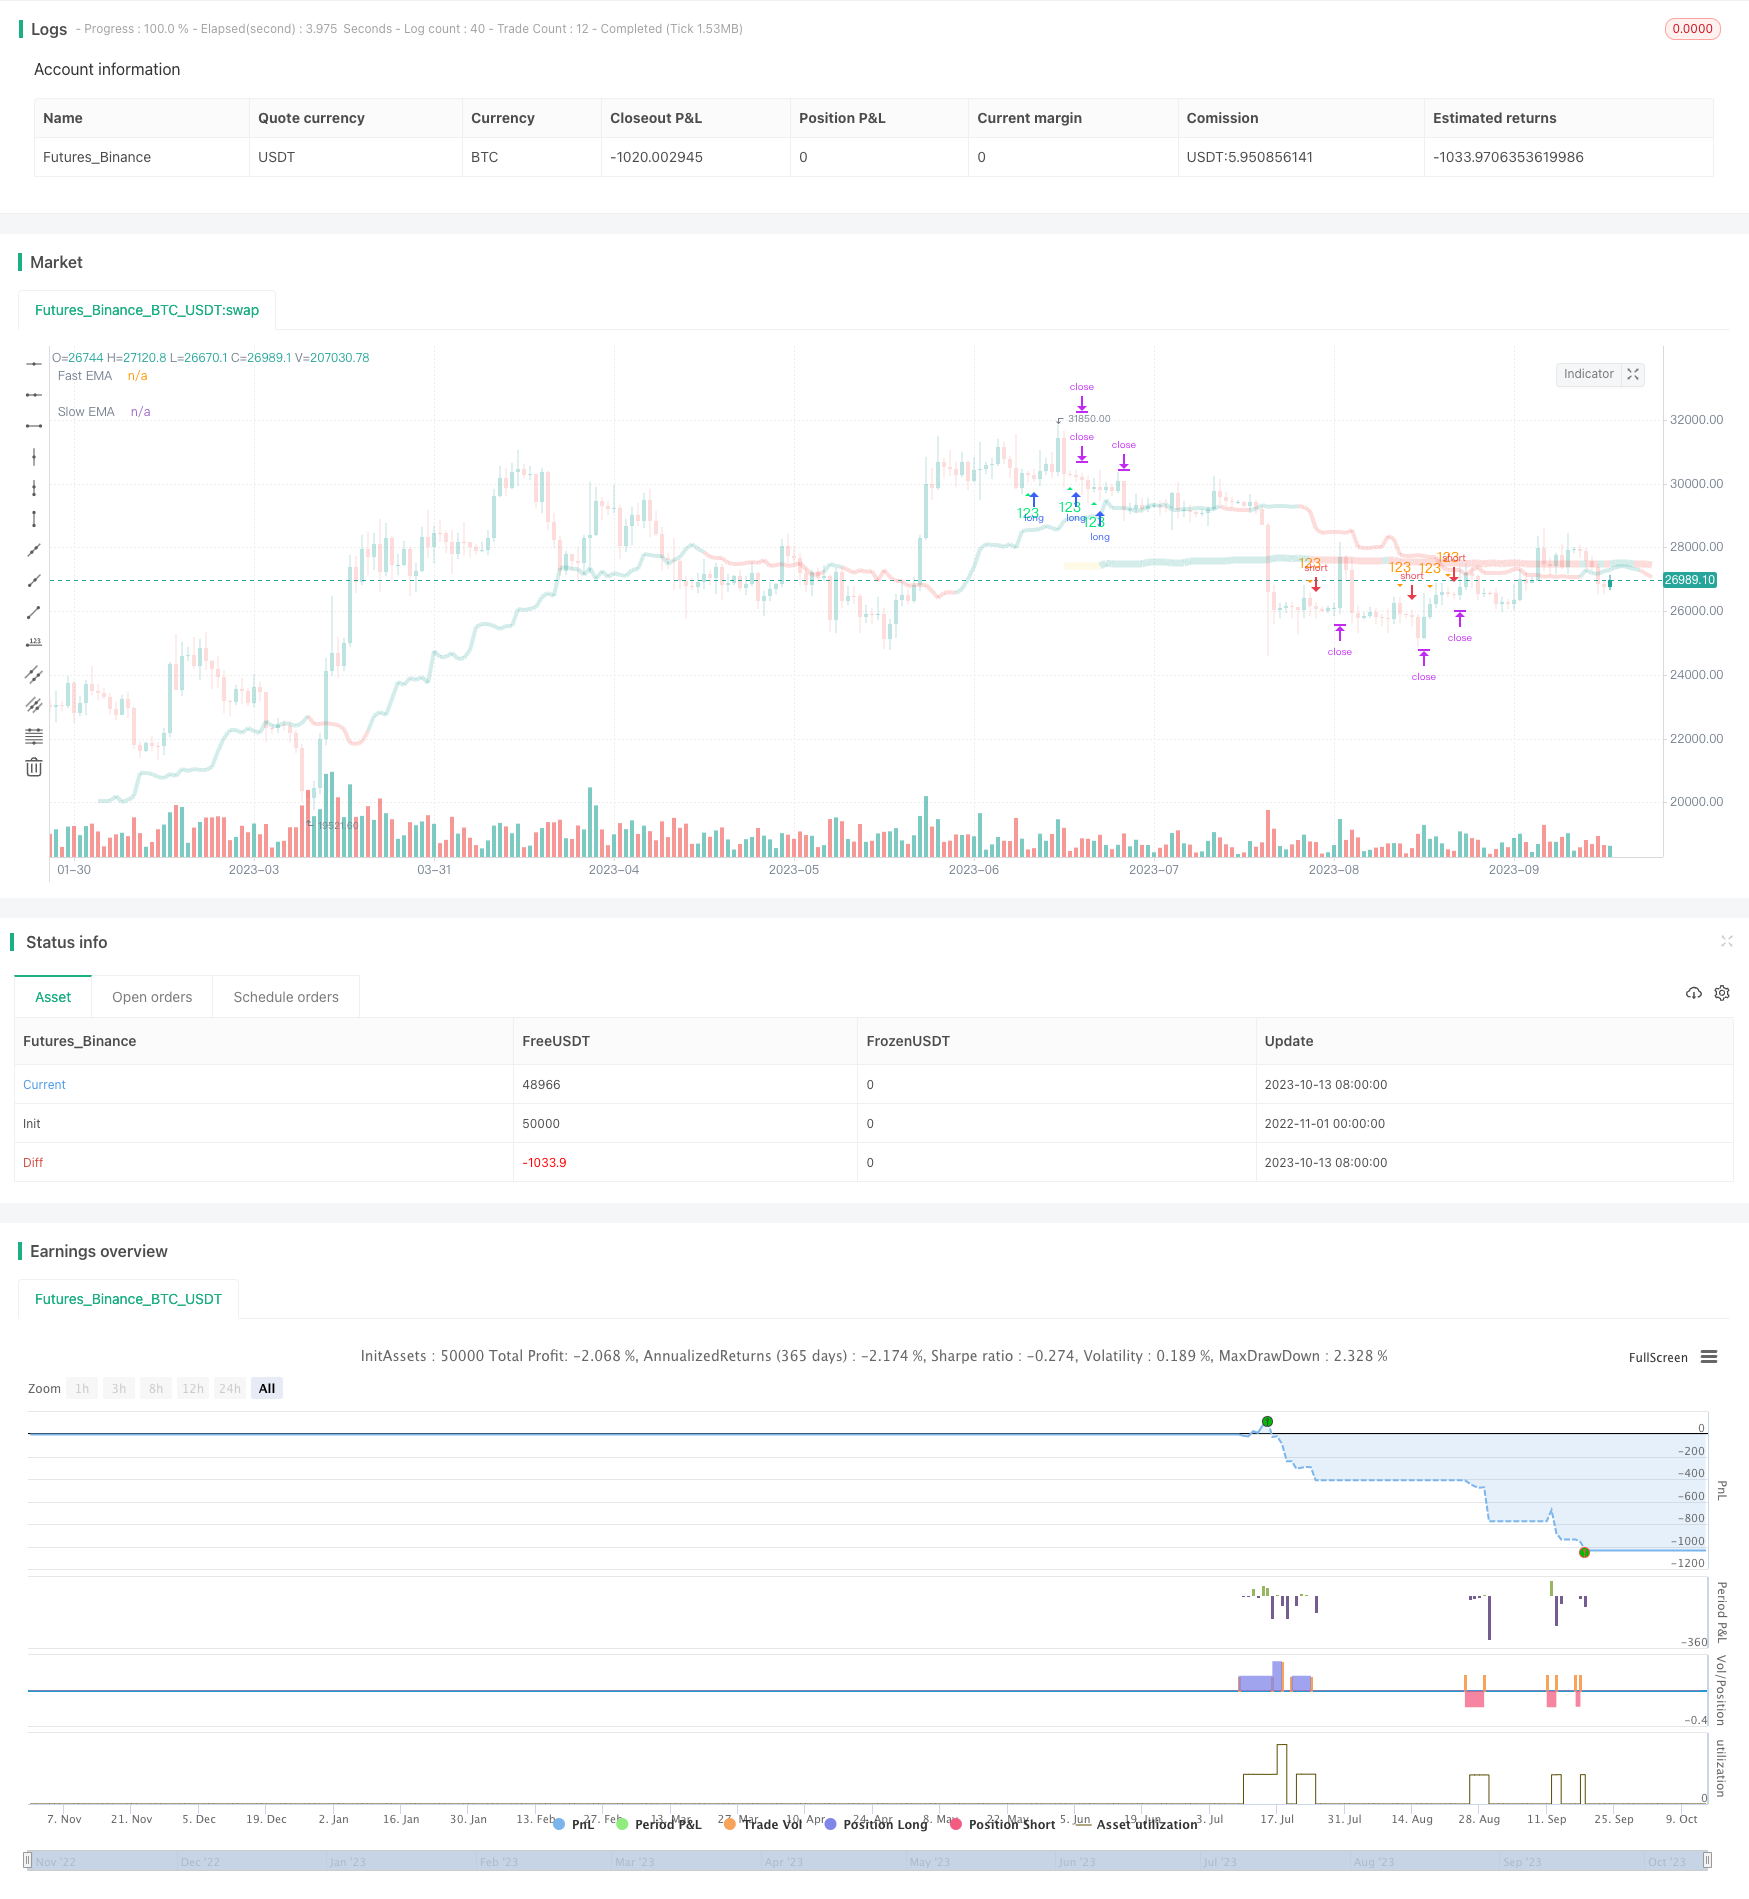
start: 2022-11-01 00:00:00
end: 2023-10-14 05:20:00
period: 1d
basePeriod: 1h
exchanges: [{"eid":"Futures_Binance","currency":"BTC_USDT"}]
*/
// This source code is subject to the terms of the Mozilla Public License 2.0 at https://mozilla.org/MPL/2.0/
// © julianossilva
//@version=5
strategy(title="J2S Backtest: 123-Stormer Strategy",
shorttitle="J2S Backtest: 123-Stormer Strategy",
overlay=true, initial_capital=1000, default_qty_value=10,
default_qty_type = strategy.percent_of_equity, pyramiding=0)
// Initial Backtest Date Range
useStartDate = timestamp("01 Jan 2020 21:00:00")
useEndDate = timestamp("01 Jan 2023 21:00:00")
// User Inputs
SIGNAL_CONFIG = "BACKTEST: STORMER STRATEGY (123)"
longEntryInput = input.bool(defval=true, title="Long Entry", group=SIGNAL_CONFIG)
shortEntryInput = input.bool(defval=true, title="Short entry", group=SIGNAL_CONFIG)
thresholdForEntryInput = input.int(defval=3, title="Threshold on clandes for entry", group=SIGNAL_CONFIG)
insideBarStrategyTitle = "Only third candle inside bar is valid"
insideBarStrategyTip = "According to Stomer, it would be the best signal for the strategy"
insideBarStrategyInput = input.bool(defval=true, title=insideBarStrategyTitle, group=SIGNAL_CONFIG, tooltip=insideBarStrategyTip)
EMA_CONFIG = "BACKTEST: EXPONENTIAL MOVING AVERAGES"
sourceInput = input.source(defval=close, title="Source", inline="01", group=EMA_CONFIG)
emaTimeframeInput = input.timeframe("1W", title="Timeframe", inline="01", group=EMA_CONFIG)
emaOffsetInput = input.int(defval=8, title="Offset", inline="01", group=EMA_CONFIG)
fastEMALengthInput = input.int(defval=8, title="Fast EMA Length", inline="02", group=EMA_CONFIG)
useFastEMAInput = input.bool(defval=true, title="Use Fast EMA", inline="02", group=EMA_CONFIG)
slowEMALengthInput = input.int(defval=80, title="Slow EMA Length", inline="03", group=EMA_CONFIG)
useSlowEMAInput = input.bool(defval=true, title="Use Slow EMA", inline="03", group=EMA_CONFIG)
PERIOD_CONFIG = "BACKTEST: TIME PERIOD"
useDateFilterInput = input.bool(defval=true, title="Filter Date Range of Backtest", group=PERIOD_CONFIG)
backtestStartDateInput = input(defval=useStartDate, title="Start Date", group=PERIOD_CONFIG)
backtestEndDateInput = input(defval=useEndDate, title="End Date", group=PERIOD_CONFIG)
// Colors
bbBackgroundColor = color.rgb(33, 150, 243, 90)
candleColorDown = color.rgb(239, 83, 80, 80)
candleColorUp = color.rgb(38, 166, 154, 70)
insideBarColorDown = color.rgb(239, 83, 80, 40)
insideBarColorUp = color.rgb(38, 166, 154, 20)
downTrendColor = color.rgb(239, 83, 80, 80)
sidewaysTrendColor = color.rgb(252, 232, 131, 80)
upTrendColor = color.rgb(38, 166, 154, 80)
buySignalColor = color.lime
sellSignalColor = color.orange
// Candles
isCandleUp() => close > open
isCandleDown() => close <= open
barcolor(isCandleUp() ? candleColorUp : isCandleDown() ? candleColorDown : na)
// Exponential Moving Averages
fastEMA = request.security(syminfo.tickerid, emaTimeframeInput, ta.ema(sourceInput, fastEMALengthInput), barmerge.gaps_on, barmerge.lookahead_on)
currentFastEMA = request.security(syminfo.tickerid, emaTimeframeInput, ta.ema(sourceInput, fastEMALengthInput), barmerge.gaps_off, barmerge.lookahead_on)
previousFastEMA = request.security(syminfo.tickerid, emaTimeframeInput, ta.ema(sourceInput[1], fastEMALengthInput), barmerge.gaps_off, barmerge.lookahead_on)
slowEMA = request.security(syminfo.tickerid, emaTimeframeInput, ta.ema(sourceInput, slowEMALengthInput), barmerge.gaps_on, barmerge.lookahead_on)
currentSlowEMA = request.security(syminfo.tickerid, emaTimeframeInput, ta.ema(sourceInput, slowEMALengthInput), barmerge.gaps_off, barmerge.lookahead_on)
previousSlowEMA = request.security(syminfo.tickerid, emaTimeframeInput, ta.ema(sourceInput[1], slowEMALengthInput), barmerge.gaps_off, barmerge.lookahead_on)
// Trend Rules for Exponential Moving Averages
isSlowEMAUp() => currentSlowEMA > previousSlowEMA
isSlowEMADown() => currentSlowEMA < previousSlowEMA
isFastEMAUp() => currentFastEMA > previousFastEMA
isFastEMADown() => currentFastEMA < previousFastEMA
// Exponential Moving Average Colors
fastEMAColor = isFastEMAUp() ? upTrendColor : isFastEMADown() ? downTrendColor : sidewaysTrendColor
slowEMAColor = isSlowEMAUp() ? upTrendColor : isSlowEMADown() ? downTrendColor : sidewaysTrendColor
// Display Exponential Moving Averages
plot(useFastEMAInput ? fastEMA : na, offset=emaOffsetInput, color=fastEMAColor, title="Fast EMA", style=plot.style_line, linewidth=4)
plot(useSlowEMAInput ? slowEMA : na, offset=emaOffsetInput, color=slowEMAColor, title="Slow EMA", style=plot.style_line, linewidth=7)
// Price Trend
pricesAboveFastEMA() => low[2] > currentFastEMA and low[1] > currentFastEMA and low > currentFastEMA
pricesAboveSlowEMA() => low[2] > currentSlowEMA and low[1] > currentSlowEMA and low > currentSlowEMA
pricesBelowFastEMA() => high[2] < currentFastEMA and high[1] < currentFastEMA and high < currentFastEMA
pricesBelowSlowEMA() => high[2] < currentSlowEMA and high[1] < currentSlowEMA and high < currentSlowEMA
// Market in Bullish Trend
isBullishTrend() =>
if useFastEMAInput and useSlowEMAInput
pricesAboveFastEMA() and pricesAboveSlowEMA()
else if useFastEMAInput
pricesAboveFastEMA()
else if useSlowEMAInput
pricesAboveSlowEMA()
else
na
// Market in Bearish Trend
isBearishTrend() =>
if useFastEMAInput and useSlowEMAInput
pricesBelowFastEMA() and pricesBelowSlowEMA()
else if useFastEMAInput
pricesBelowFastEMA()
else if useSlowEMAInput
pricesBelowSlowEMA()
else
na
// Stormer Strategy (123)
isFirstCandleUp() => high[2] > high[1] and low[2] > low[1]
isFirstCandleDown() => high[2] < high[1] and low[2] < low[1]
isThirdCandleUp() => low > low[1]
isThirdCandleDown() => high < high[1]
isThirdCandleInsideBar() => high < high[1] and low > low[1]
// Buy Signal
isStormer123Buy() =>
if insideBarStrategyInput
longEntryInput and isFirstCandleUp() and isThirdCandleInsideBar() and isBullishTrend()
else
longEntryInput and isFirstCandleUp() and isThirdCandleUp() and isBullishTrend()
// Sell Signal
isStormer123Sell() =>
if insideBarStrategyInput
shortEntryInput and isFirstCandleDown() and isThirdCandleInsideBar() and isBearishTrend()
else
shortEntryInput and isFirstCandleDown() and isThirdCandleDown() and isBearishTrend()
// Backtest Time Period
inTradeWindow = true
isInTradeWindow() => inTradeWindow
isBacktestDateRangeOver() => not inTradeWindow and inTradeWindow[1]
// Backtest Price Parameters
highestPrice = ta.highest(high, 3)
lowestPrice = ta.lowest(low,3)
priceRange = highestPrice - lowestPrice
// Stormer Strategy (123): LONG
var myLongOrders = array.new_int(0)
longtEntryID = "Long Entry:\n" + str.tostring(bar_index)
longExitID = "Long Exit:\n" + str.tostring(bar_index)
stopLossInLong = lowestPrice + 0.01
takeProfitInLong = priceRange + high
longEntryHasBeenMet = isInTradeWindow() and isBullishTrend() and isStormer123Buy()
// Scheduling LONG entry
if longEntryHasBeenMet
array.push(myLongOrders, bar_index)
strategy.order(longtEntryID, strategy.long, stop=high)
strategy.exit(longExitID, longtEntryID, stop=stopLossInLong, limit=takeProfitInLong)
// In pine script, any order scheduled but not yet filled can be canceled.
// Once a order is filled, the trade is only finished with use of close or exit functions.
// As scheduled orders are not stored in the strategy.opentrades array, manual control is required.
for myOrderIndex = 0 to (array.size(myLongOrders) == 0 ? na : array.size(myLongOrders) - 1)
myLongOrder = array.get(myLongOrders, myOrderIndex)
if bar_index - myLongOrder == thresholdForEntryInput
longEntryID = "Long Entry:\n" + str.tostring(myLongOrder)
strategy.cancel(longEntryID)
// Stormer Strategy (123): SHORT
var myShortOrders = array.new_int(0)
shortEntryID = "Short Entry:\n" + str.tostring(bar_index)
shortExitID = "Short Exit:\n" + str.tostring(bar_index)
stopLossInShort = highestPrice + 0.01
takeProfitInShort = low - priceRange
shortEntryHasBeenMet = isInTradeWindow() and isBearishTrend() and isStormer123Sell()
// Scheduling SHORT entry
if shortEntryHasBeenMet
array.push(myShortOrders, bar_index)
strategy.order(shortEntryID, strategy.short, stop=low)
strategy.exit(shortExitID, shortEntryID, stop=stopLossInShort, limit=takeProfitInShort)
// In pine script, any order scheduled but not yet filled can be canceled.
// Once a order is filled, the trade is only finished with use of close or exit functions.
// As scheduled orders are not stored in the strategy.opentrades array, manual control is required.
for myOrderIndex = 0 to (array.size(myShortOrders) == 0 ? na : array.size(myShortOrders) - 1)
myShortOrder = array.get(myShortOrders, myOrderIndex)
if bar_index - myShortOrder == thresholdForEntryInput
shortEntryID := "Short Entry:\n" + str.tostring(myShortOrder)
strategy.cancel(shortEntryID)
// Close all positions at the end of the backtest period
if isBacktestDateRangeOver()
strategy.cancel_all()
strategy.close_all(comment="Date Range Exit")
// Display Signals
plotshape(series=longEntryHasBeenMet, title="123 Buy", style=shape.triangleup, location=location.belowbar, color=buySignalColor, text="123", textcolor=buySignalColor)
plotshape(series=shortEntryHasBeenMet, title="123 Sell", style=shape.triangledown, location=location.abovebar, color=sellSignalColor, text="123", textcolor=sellSignalColor)