Chiến lược giao dịch kép dựa trên MACD

Tác giả:ChaoZhang, Ngày: 2023-12-07 17:11:52
Tags:

img

Tổng quan

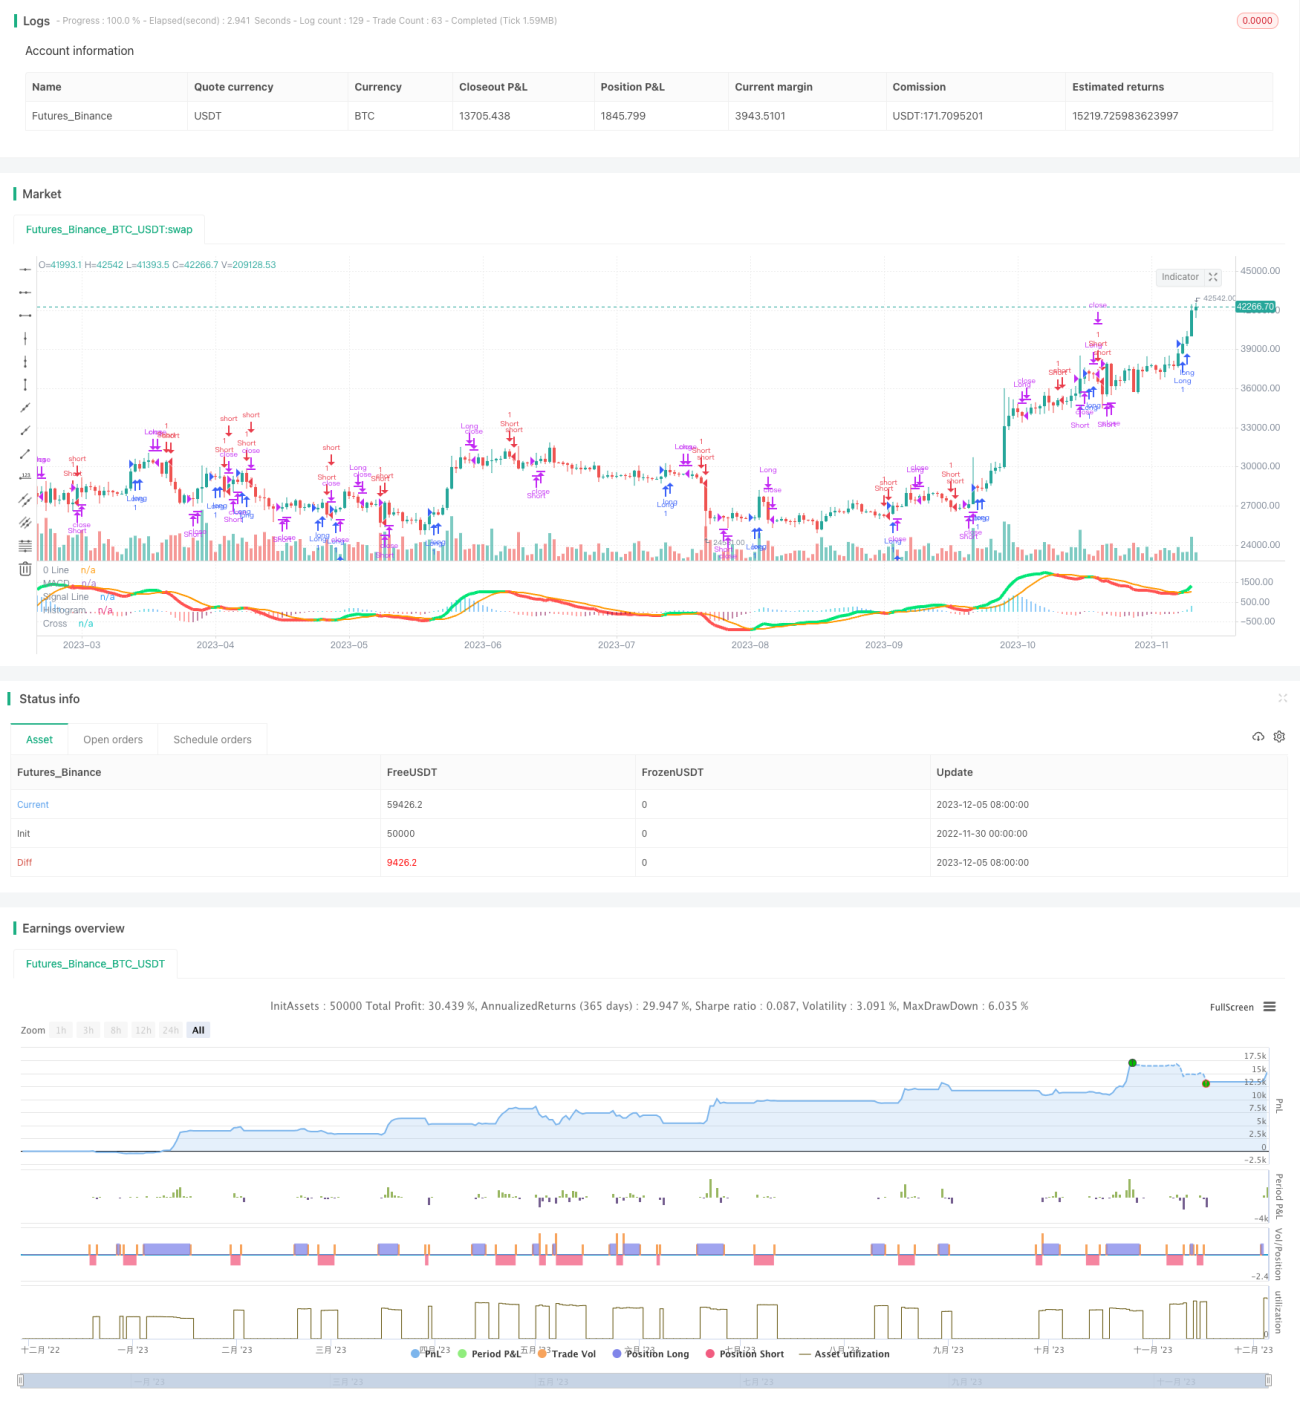
Chiến lược này thực hiện một chiến lược giao dịch kép dựa trên chỉ số MACD. Nó có thể đi dài khi có một thập tự vàng trên MACD và đi ngắn khi có một thập tự chết, với các bộ lọc bổ sung dựa trên các chỉ số khác để loại bỏ một số tín hiệu không hợp lệ.

Nguyên tắc chiến lược

Cốt lõi của chiến lược này là sử dụng chỉ số MACD để nhận ra giao dịch hai hướng. Cụ thể, nó tính toán trung bình di chuyển nhanh, trung bình di chuyển chậm và đường tín hiệu MACD. Khi MA nhanh vượt qua MA chậm, một thập tự vàng được tạo ra để đi dài. Khi MA nhanh vượt dưới MA chậm, một thập tự tử được tạo ra để đi ngắn.

Để lọc một số tín hiệu không hợp lệ, chiến lược cũng đặt một phạm vi ±30 như một bộ lọc, do đó tín hiệu giao dịch chỉ được kích hoạt khi biểu đồ MACD vượt quá phạm vi này. Ngoài ra, khi đóng các vị trí, nó cũng đánh giá hướng biểu đồ MACD - các vị trí chỉ được đóng khi hướng của hai thanh biểu đồ liên tiếp thay đổi.

Ưu điểm

  • Chỉ số MACD được sử dụng như là tín hiệu giao dịch chính, nhạy cảm với biến động giá theo cả hai hướng
  • Các bộ lọc được thêm vào giúp loại bỏ một số tín hiệu không hợp lệ
  • Logic hướng hai thanh để đóng các vị trí tránh một số sự phá vỡ sai ở một mức độ nào đó

Rủi ro

  • Chỉ số MACD có xu hướng tạo ra các tín hiệu giao dịch thường xuyên, dẫn đến tần suất giao dịch cao
  • Chỉ dựa vào một chỉ số làm cho chiến lược dễ bị chậm tín hiệu
  • Logic đóng dựa trên hướng biểu đồ không đủ nghiêm ngặt, có nguy cơ bỏ lỡ một số tín hiệu

Hướng dẫn tối ưu hóa

  • Xem xét kết hợp với các chỉ số khác để xác nhận tín hiệu, chẳng hạn như KDJ, Bollinger Bands vv.
  • Nghiên cứu các chỉ số tiên tiến hơn để thay thế MACD, như KD
  • Tối ưu hóa logic đóng cửa bằng cách đặt dừng lỗ và lấy lợi nhuận để kiểm soát lỗ giao dịch duy nhất

Kết luận

Tóm lại, đây là một chiến lược giao dịch hai hướng về cơ bản có thể thực hiện được. Nó sử dụng những lợi thế của chỉ số MACD và cũng thêm một số bộ lọc để kiểm soát chất lượng tín hiệu. Tuy nhiên, MACD cũng có một số vấn đề. Việc thử nghiệm và tối ưu hóa thêm trong giao dịch trực tiếp vẫn cần thiết để làm cho chiến lược đáng tin cậy hơn. Nhìn chung, chiến lược này đặt nền tảng cho các chiến lược giao dịch hai hướng, và có thể được tối ưu hóa thêm dần để trở thành một chiến lược giao dịch định lượng mạnh mẽ.

]


/*backtest
start: 2022-11-30 00:00:00
end: 2023-12-06 00:00:00
period: 1d
basePeriod: 1h
exchanges: [{"eid":"Futures_Binance","currency":"BTC_USDT"}]
*/

//@version=3

//Created by user ChrisMoody updated 4-10-2014
//Regular MACD Indicator with Histogram that plots 4 Colors Based on Direction Above and Below the Zero Line
//Update allows Check Box Options, Show MacD & Signal Line, Show Change In color of MacD Line based on cross of Signal Line.
//Show Dots at Cross of MacD and Signal Line, Histogram can show 4 colors or 1, Turn on and off Histogram.
//Special Thanks to that incredible person in Tech Support whoem I won't say you r name so you don't get bombarded with emails
//Note the feature Tech Support showed me on how to set the default timeframe of the indicator to the chart Timeframe, but also allow you to choose a different timeframe.
//By the way I fully disclose that I completely STOLE the Dots at the MAcd Cross from "TheLark"

strategy("MACD Strategy", overlay=false)
// study(title="CM_MacD_Ult_MTF", shorttitle="CM_Ult_MacD_MTF")
source = close
useCurrentRes = input(true, title="Use Current Chart Resolution?")
resCustom = input(title="Use Different Timeframe? Uncheck Box Above", defval="60")
smd = input(true, title="Show MacD & Signal Line? Also Turn Off Dots Below")
sd = input(true, title="Show Dots When MacD Crosses Signal Line?")
sh = input(true, title="Show Histogram?")
macd_colorChange = input(true,title="Change MacD Line Color-Signal Line Cross?")
hist_colorChange = input(true,title="MacD Histogram 4 Colors?")

res = useCurrentRes ? timeframe.period : resCustom

fastLength = input(12, minval=1), slowLength=input(26,minval=1)
signalLength=input(9,minval=1)

fastMA = ema(source, fastLength)
slowMA = ema(source, slowLength)

macd = fastMA - slowMA
signal = sma(macd, signalLength)
hist = macd - signal

outMacD = request.security(syminfo.tickerid, res, macd)
outSignal = request.security(syminfo.tickerid, res, signal)
outHist = request.security(syminfo.tickerid, res, hist)

histA_IsUp = outHist > outHist[1] and outHist > 0
histA_IsDown = outHist < outHist[1] and outHist > 0
histB_IsDown = outHist < outHist[1] and outHist <= 0
histB_IsUp = outHist > outHist[1] and outHist <= 0

//MacD Color Definitions
macd_IsAbove = outMacD >= outSignal
macd_IsBelow = outMacD < outSignal


// strategy.entry("Long", strategy.long, 1, when = shouldPlaceLong) 
       
// strategy.close("Long", shouldExitLong)
    

// strategy.entry("Short", strategy.short, 1, when = shouldPlaceShort) 
       
// strategy.close("Short", shouldExitShort)
    
    
isWithinZeroMacd = outHist < 30 and outHist > -30 

delta = hist
// shouldExitShort = false//crossover(delta, 0)    
// shouldExitLong = false//crossunder(delta, 0)

// if(crossover(delta, 0))// and not isWithinZeroMacd)
//     strategy.entry("Long", strategy.long, comment="Long")

// if (crossunder(delta, 0))// and not isWithinZeroMacd)
//     strategy.entry("Short", strategy.short, comment="Short")
    
shouldPlaceLong = crossover(delta, 0)
    
strategy.entry("Long", strategy.long, 1, when = shouldPlaceLong) 

shouldExitLong = not histA_IsUp and histA_IsDown

shouldExitShort = not histA_IsUp and not histA_IsDown and not histB_IsDown and histB_IsUp

shouldPlaceShort = crossunder(delta, 0)
strategy.entry("Short", strategy.short, 1, when = shouldPlaceShort) 
       
// plot_color = gray
plot_color = if(hist_colorChange)
	if(histA_IsUp)
	    aqua
	else
		if(histA_IsDown)
			//need to sell
// 			if(not isWithinZeroMacd)
// 			shouldExitLong = true
			    //   strategy.entry("Short", strategy.short, comment="Short")
			
			blue
		else
			if(histB_IsDown)
				red 
			else
				if(histB_IsUp)
					//need to buy
				// 	if(not isWithinZeroMacd)
				// 	shouldExitShort = true
					   // strategy.entry("Long", strategy.long, comment="Long")
					    
					    
					maroon
				else
					yellow
else
	gray


// plot_color = hist_colorChange ? histA_IsUp ? aqua : histA_IsDown ? blue : histB_IsDown ? red : histB_IsUp ? maroon :yellow :gray
macd_color = macd_colorChange ? macd_IsAbove ? lime : red : red
signal_color = macd_colorChange ? macd_IsAbove ? orange : orange : lime

circleYPosition = outSignal

plot(smd and outMacD ? outMacD : na, title="MACD", color=macd_color, linewidth=4)
plot(smd and outSignal ? outSignal : na, title="Signal Line", color=signal_color, style=line ,linewidth=2)
plot(sh and outHist ? outHist : na, title="Histogram", color=plot_color, style=histogram, linewidth=4)
plot(sd and cross(outMacD, outSignal) ? circleYPosition : na, title="Cross", style=circles, linewidth=4, color=macd_color)

// plot( isWithinZeroMacd ? outHist : na, title="CheckSmallHistBars", style=circles, linewidth=4, color=black)

hline(0, '0 Line',  linewidth=2, color=white)


strategy.close("Short", shouldExitShort)
strategy.close("Long", shouldExitLong)

// fastLength = input(12)
// slowlength = input(26)
// MACDLength = input(9)

// MACD = ema(close, fastLength) - ema(close, slowlength)
// aMACD = ema(MACD, MACDLength)
// delta = MACD - aMACD


// if (crossover(delta, 0))
   // strategy.entry("MacdLE", strategy.long, comment="MacdLE")

//if last two macd bars are higher than current, close long position

// if (crossunder(delta, 0))
   // strategy.entry("MacdSE", strategy.short, comment="MacdSE")

//if last two macd bars are higher than current, close long position

// plot(strategy.equity, title="equity", color=red, linewidth=2, style=areabr)

Thêm nữa