Chiến lược giao dịch định lượng dựa trên số ngẫu nhiên
Tổng quan
Ý tưởng cốt lõi của chiến lược này là sử dụng số ngẫu nhiên để mô phỏng các sự kiện xác suất như đồng xu, tùy thuộc vào kết quả của sự kiện, quyết định làm nhiều đầu hoặc đầu trống, để thực hiện giao dịch ngẫu nhiên. Chiến lược giao dịch này có thể được sử dụng để thử nghiệm mô phỏng hoặc có thể được sử dụng như một khuôn khổ cơ bản để phát triển chiến lược phức tạp hơn.
Nguyên tắc chiến lược
vượt qua
flipCác biến mô phỏng sự kiện ngẫu nhiên, dựa trêncoinLabelSố lượng ngẫu nhiên quyết định làm thêm hoặc làm trống.Sử dụng
riskVàratioCài đặt dây dừng thiệt hại.Bắt đầu giao dịch theo số lần tối đa được thiết lập.
vượt qua
plotBoxKiểm soát biến liệu cho thấy hộp thanh toán.stoppedOutVàtakeProfitBiến số được sử dụng để phát hiện dừng hoặc dừng.Cung cấp phản hồi về hiệu suất chiến lược kiểm tra chức năng.
Phân tích lợi thế
Cấu trúc mã rõ ràng, dễ hiểu và phát triển thứ hai.
UI tương tác thân thiện, các tham số có thể được điều chỉnh thông qua giao diện đồ họa.
Có tính ngẫu nhiên cao, không bị ảnh hưởng bởi biến động thị trường, có độ tin cậy cao.
Có thể đạt được lợi nhuận tốt hơn bằng cách tối ưu hóa tham số.
Nó có thể được sử dụng để trình diễn hoặc thử nghiệm các chiến lược khác.
Phân tích rủi ro
Giao dịch ngẫu nhiên không có khả năng đánh giá thị trường, có một số rủi ro lợi nhuận.
Không thể xác định được sự kết hợp tối ưu của các tham số, cần thử nghiệm nhiều lần.
Rủi ro siêu liên quan có thể xảy ra do tín hiệu ngẫu nhiên quá dày đặc.
Nó được khuyến cáo kết hợp với hệ thống ngăn chặn thiệt hại để kiểm soát rủi ro.
Bạn có thể giảm rủi ro bằng cách kéo dài khoảng thời gian giao dịch.
Hướng tối ưu hóa
Kết hợp các yếu tố phức tạp hơn tạo ra tín hiệu ngẫu nhiên.
Tăng các loại thương mại, mở rộng phạm vi thử nghiệm.
Tối ưu hóa tương tác UI, thêm chức năng kiểm soát chính sách.
Cung cấp nhiều công cụ và chỉ số kiểm tra để tối ưu hóa các tham số.
Có thể được thêm vào các chiến lược khác như một tín hiệu giao dịch hoặc thành phần dừng lỗ.
Tóm tắt
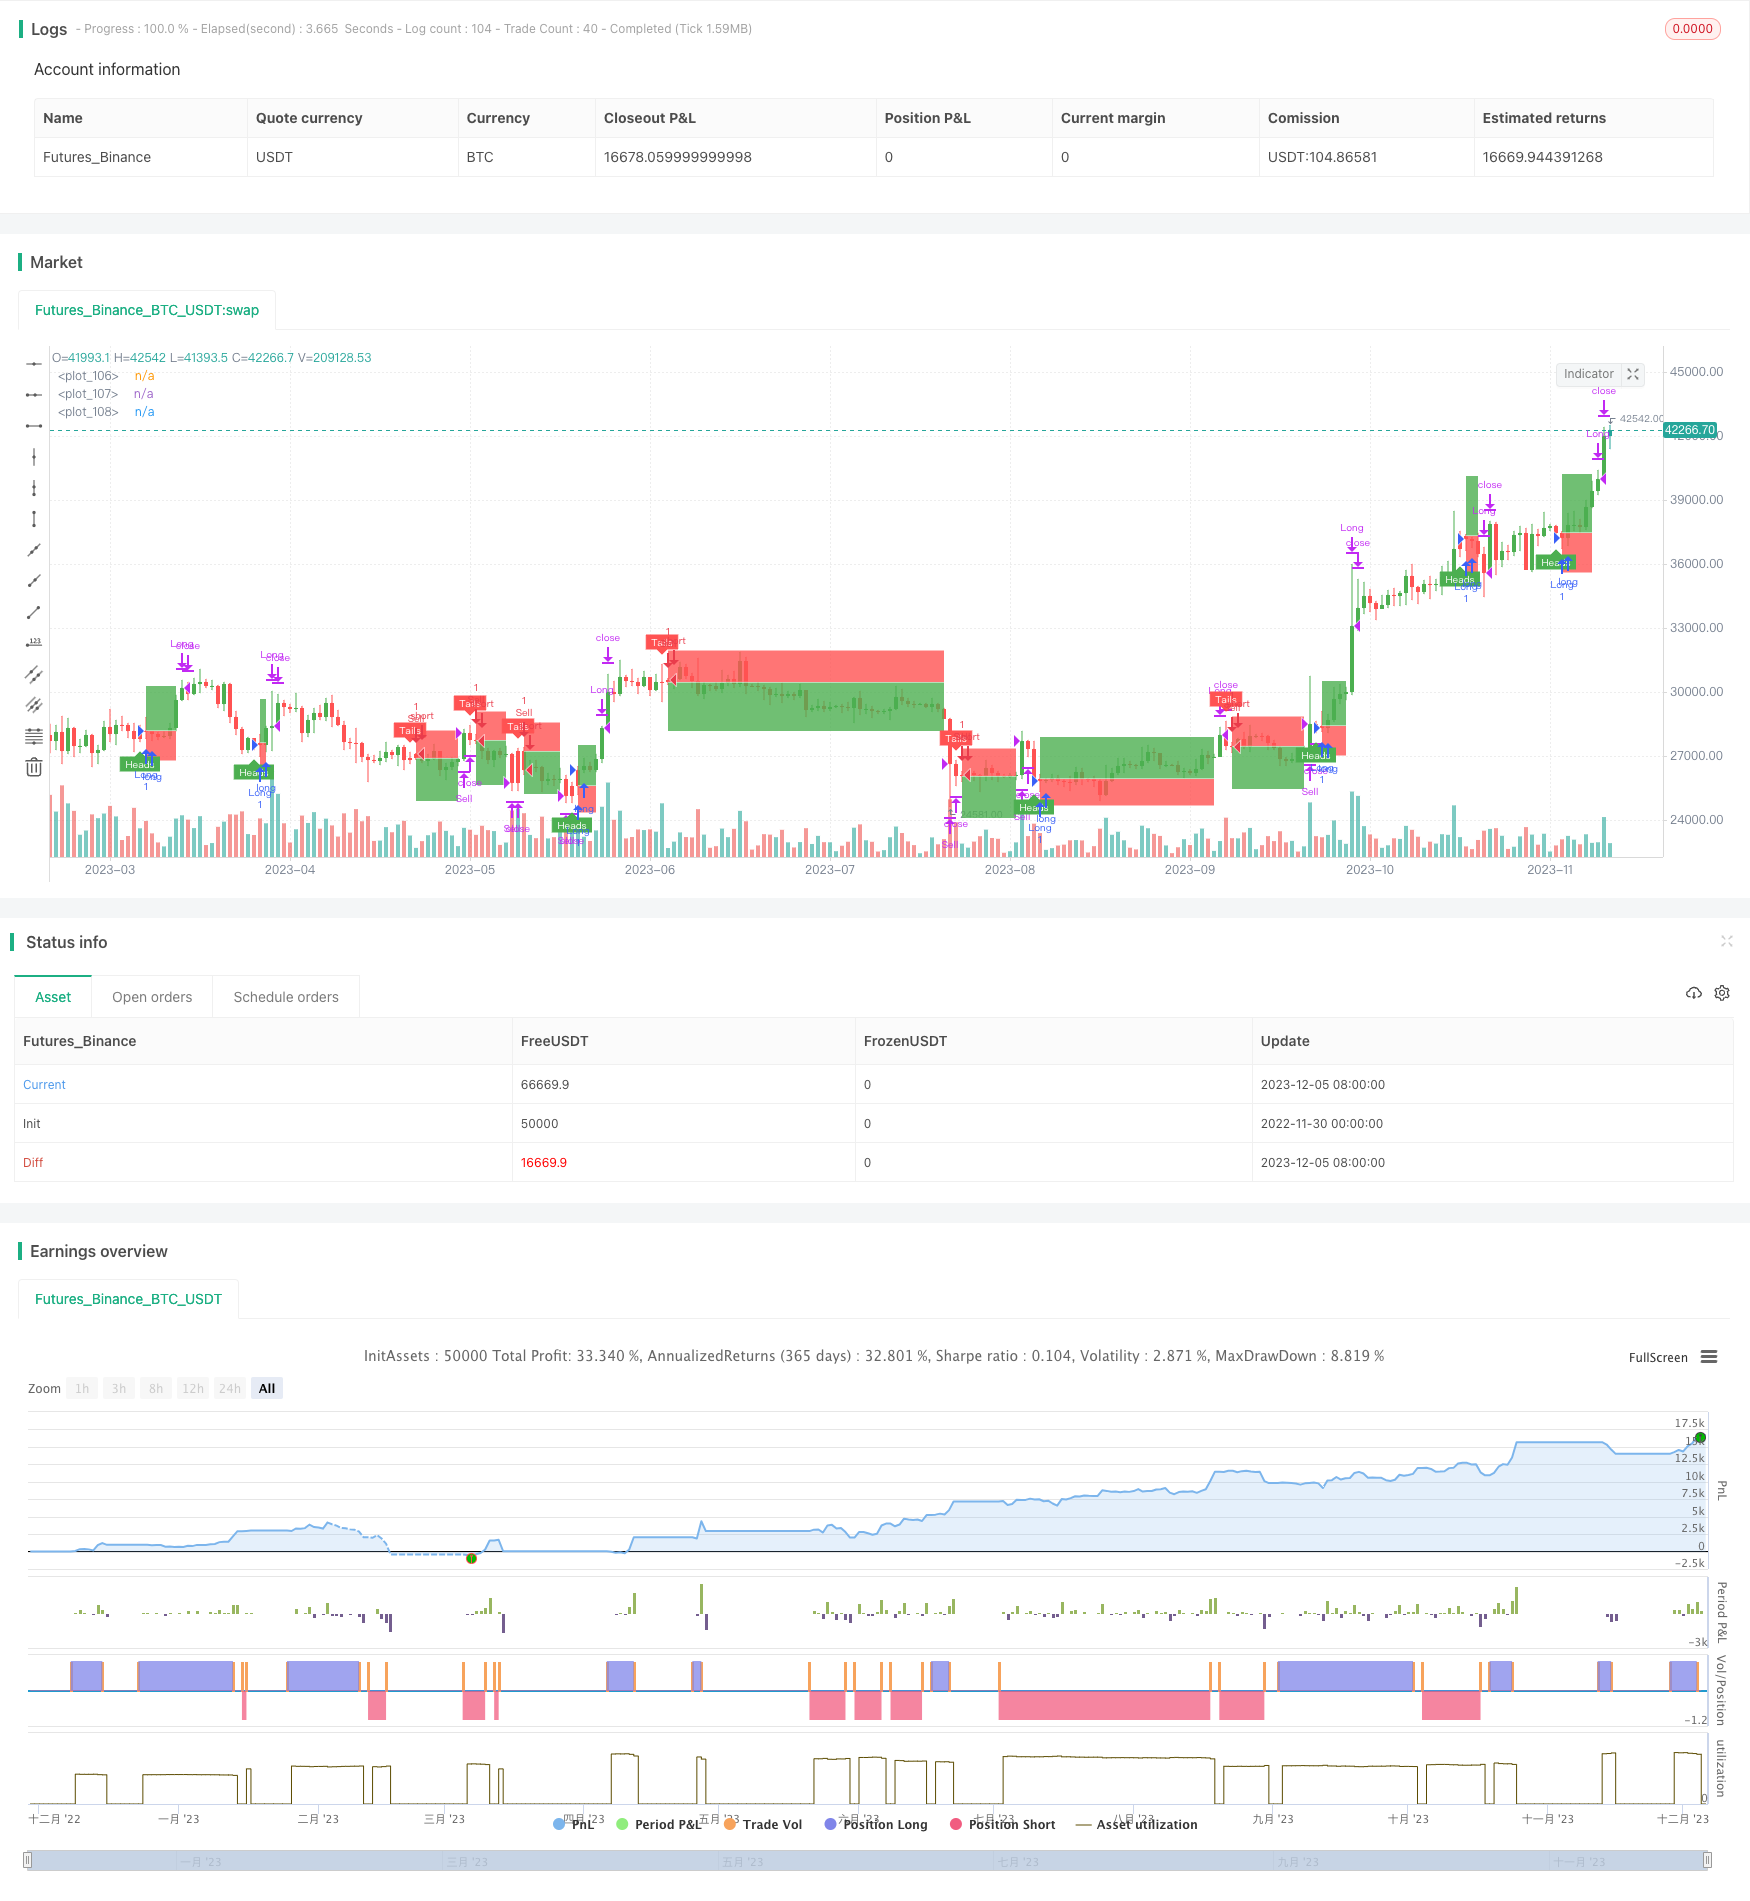
Khung tổng thể của chiến lược này được hoàn thiện, tạo ra tín hiệu giao dịch dựa trên sự kiện ngẫu nhiên, có độ tin cậy cao. Ngoài ra, nó cung cấp điều chỉnh tham số, đo lường lại và chức năng vẽ. Nó có thể được sử dụng để kiểm tra chiến lược phát triển mới và làm mô-đun cơ bản cho các chiến lược khác.
/*backtest
start: 2022-11-30 00:00:00
end: 2023-12-06 00:00:00
period: 1d
basePeriod: 1h
exchanges: [{"eid":"Futures_Binance","currency":"BTC_USDT"}]
*/

// This source code is subject to the terms of the Mozilla Public License 2.0 at https://mozilla.org/MPL/2.0/
// © melodicfish

//@version=4
strategy("Coin Flipper Pro",overlay=true,max_bars_back=100)

// ======= User Inputs variables=========

h1=input(title="------- Trade Activity -------",defval=false)
maxBars=input(25.0,title="Max Bars between Coin Filps",step=1.0,minval=4.0)

h2=input(title="------- Position Settings -------",defval=false)
risk=input(defval=5.0,title="Risk in % ",type=input.float, minval=0.001 ,step=0.1)
ratio= input(defval=1.5,title="Risk to Reward Ratio x:1 ",type=input.float, minval=0.001,step=0.1)

h3=input(title="------- Plot Options -------",defval=false)
showBox=input(defval=true, title="Show Position Boxes")

h4=input(title="------- Back Testing -------",defval=false)
runTest=input(defval=true, title="Run Strategy Back Test")
customTime=input(defval=false, title="Use Custom Date Range for back test")


tsYear = input(2021,minval=1000,maxval=9999,title= "Test Start Year")
tsMonth = input(1,minval=1,maxval=12,title= "Test Start Month")
tsDay = input(1,minval=1,maxval=31,title= "Test Start Day")
start = timestamp(tsYear,tsMonth,tsDay,0,0)

teYear = input(2021,minval=1000,maxval=9999,title=  "Test Stop Year")
teMonth = input(5,minval=1,maxval=12,title=  "Test Stop Month")
teDay = input(1,minval=1,maxval=31,title=  "Test Stop Day")
end = timestamp(teYear,teMonth,teDay,0,0)

// ======= variables =========
var barsBetweenflips=25
var coinFlipResult=0.0
var flip=true
var coinLabel=0.0
var stoppedOut= true
var takeProfit=true
var posLive=false
var p1=0.0
var p2=0.0
var p3=0.0
var plotBox=false
var posType=0
long=false
short=false


// ===== Functions ======

getColor() =>
    round(random(1,255))


// ===== Logic ========
if barssince(flip==true)>barsBetweenflips and posLive==false
    flip:=true
    coinLabel:=random(1,10)

    // Candle Colors
candleColor= flip==true and flip[1]==false and barstate.isconfirmed==false?color.rgb(getColor(),getColor(),getColor(),0):flip==false and close>=open?color.green:color.red
candleColor:= barstate.ishistory==true and close>=open?color.green: barstate.ishistory==true and close<open? color.red:candleColor
barcolor(candleColor)

if flip[1]==true and posLive==false
    flip:=false
    barsBetweenflips:=round(random(3,round(maxBars)))
    posLive:=true

long:= flip[1]==true and coinLabel[1]>=5.0
short:= flip[1]==true and coinLabel[1]<5.0


    // Calculate Position Boxes
if long==true and posType!=1

    riskLDEC=1-(risk/100)
    p1:= close[1]*(1+((risk/100)*ratio)) // TargetLine
    p2:=close[1]
    p3:= close[1]*riskLDEC // StopLine
    plotBox:=true
    posType:=1

if short==true and posType!=-1

    riskSDEC=1-((risk*ratio)/100)
    p1:= close[1]*riskSDEC   // TargetLine
    p2:=close[1]
    p3:= close[1]*(1+(risk/100)) // StopLine
    plotBox:=true
    posType:=-1


    // Check Trade Status
stoppedOut:= posType==1 and long==false and low<= p3? true: posType==-1 and short==false and high>=p3? true: false
takeProfit:= posType==1 and long == false and high>= p1? true: posType==-1 and short==false and low<=p1? true: false
if stoppedOut==true or takeProfit==true
    posType:=0
    plotBox:=false
    posLive:=false


// ====== Plots ========
plot1=plot(plotBox and showBox? p1:na,style=plot.style_linebr,color=color.white, transp= 100)
plot2=plot(plotBox and showBox? p2:na,style=plot.style_linebr,color=color.white, transp= 100)
plot3=plot(plotBox and showBox? p3:na,style=plot.style_linebr,color=color.white, transp= 100)
fill(plot1,plot2,color= color.green)
fill(plot2,plot3,color= color.red)
plotshape(flip==true and flip[1]==false and coinLabel>=5.0,style=shape.labelup,location=location.belowbar, color=color.green,size=size.tiny,title="short label",text="Heads",textcolor=color.white)
plotshape(flip==true and flip[1]==false and coinLabel<5.0,style=shape.labeldown,location=location.abovebar, color=color.red,size=size.tiny,title="short label",text="Tails",textcolor=color.white)
if stoppedOut==true
    label.new(bar_index-1, p3, style=label.style_xcross, color=color.orange)
if takeProfit==true
    label.new(bar_index-1, p1, style=label.style_flag, color=color.blue)


if runTest==true and customTime==false or runTest==true and customTime==true and time >= start and time <= end
    strategy.entry("Sell", strategy.short,when=short==true)
    strategy.close("Sell", comment="Close Short", when=stoppedOut==true or takeProfit==true)
    strategy.entry("Long", strategy.long,when=long==true)
    strategy.close("Long",comment="Close Long", when= stoppedOut==true or takeProfit==true )