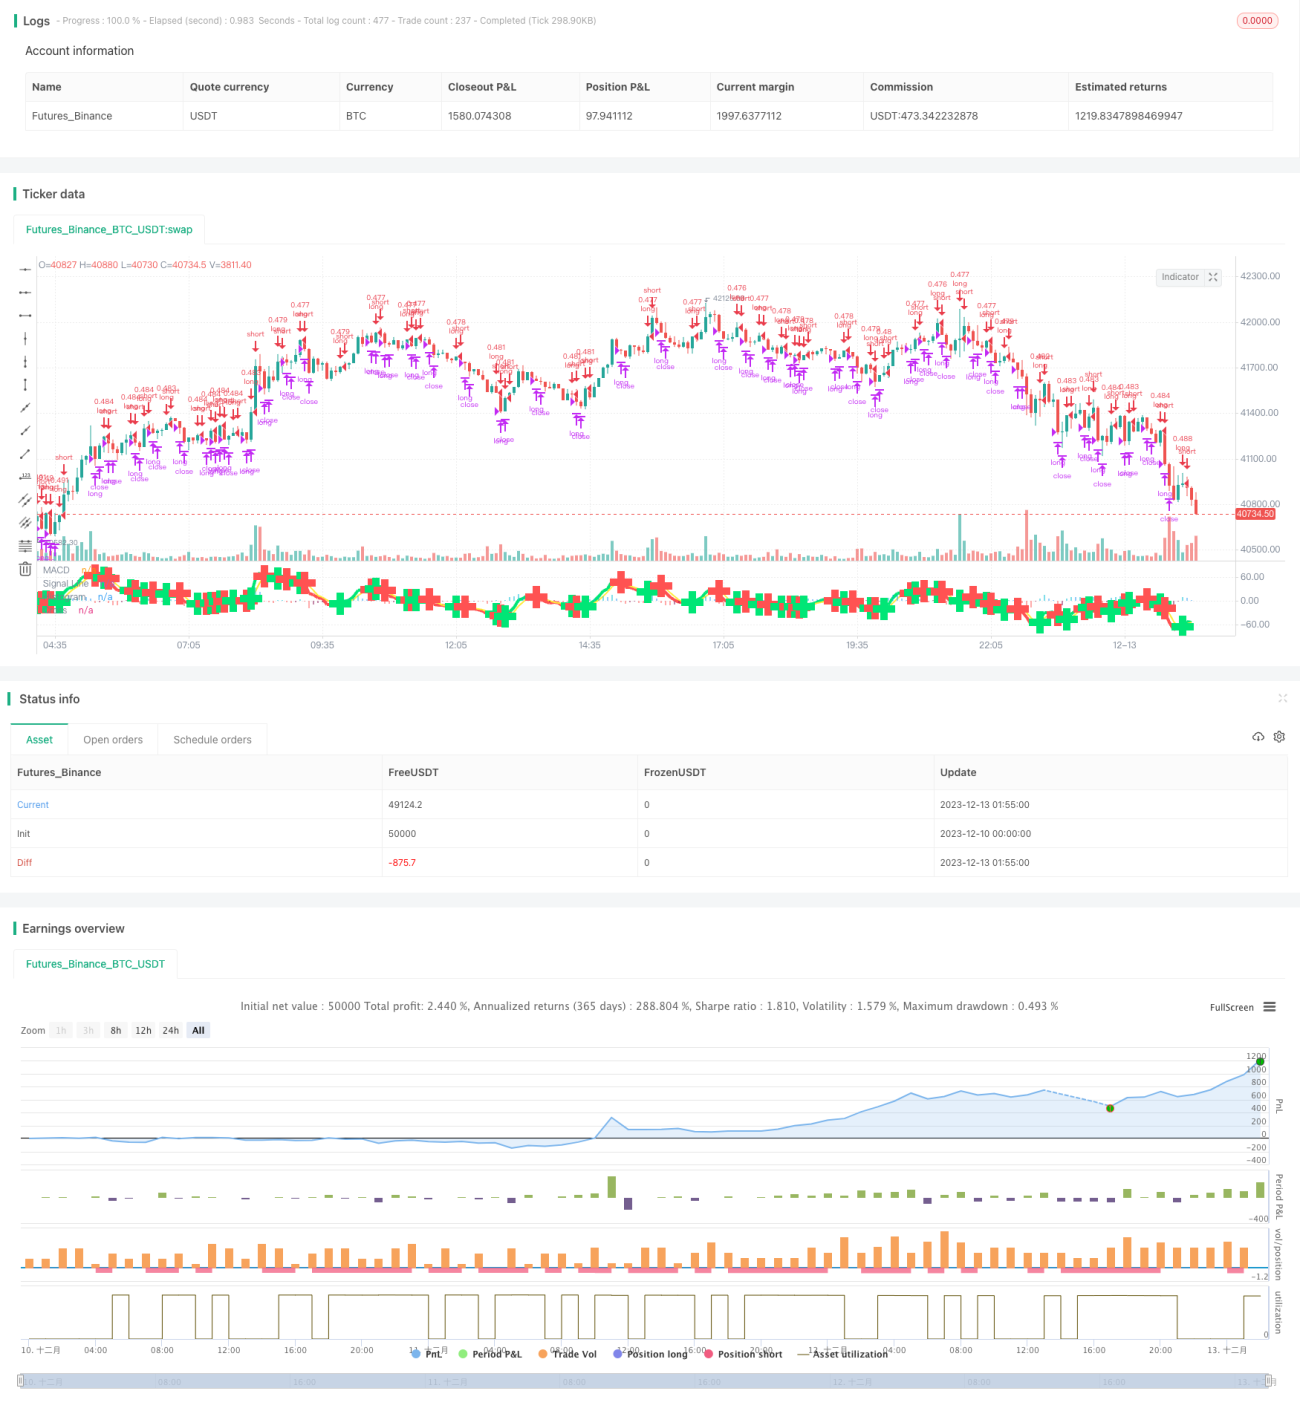
Chiến lược giao dịch đường trung bình động kép dựa trên chỉ báo MACD

1
Follow
1779
Followers
Tổng quan
Chiến lược này có tên làChiến lược theo dõi đường hai chiều của MACD, sử dụng MACD chỉ số của Binary Equity Gold Forks Dead Forks như là một tín hiệu giao dịch, kết hợp với giá thấp nhất ngày hôm qua như là điểm dừng lỗ, theo dõi giá cổ phiếu đường ngắn di chuyển.
Nguyên tắc chiến lược
- Tính toán đường nhanh EMA ((close, 5), đường chậm EMA ((close, 8) và đường tín hiệu SMA ((MACD, 3)
- Định nghĩa tín hiệu đa đầu: làm nhiều hơn khi đi qua dây chậm trên dây nhanh
- Định nghĩa tín hiệu đầu trống: Đường nhanh dưới đường đi qua đường chậm hoặc khống chế khi giá đóng cửa trong ngày thấp hơn giá thấp nhất ngày hôm qua
- Số lượng nắm giữ là $ 2000 vốn ban đầu chia cho giá đóng cửa
- Nhiều đầu dừng sử dụng tín hiệu không đầu bằng phẳng
Phân tích lợi thế
- Sử dụng chỉ số MACD để đánh giá khu vực quá mua quá bán của thị trường, kết hợp với tín hiệu giao dịch hình thành đường hai ngang, tránh phá vỡ giả
- Theo dõi xu hướng ngắn hạn, dừng lỗ kịp thời
- Cải chỉnh động lực nắm giữ để tránh tổn thất đơn lẻ quá lớn
Phân tích rủi ro
- Chỉ số MACD bị tụt hậu, có thể bỏ lỡ cơ hội rút ngắn
- Tín hiệu giao dịch song song có thể tạo ra tín hiệu giả
- Điểm dừng quá cấp tiến, có thể có quá nhiều điểm dừng
Hướng tối ưu hóa
- Tối ưu hóa sự kết hợp các tham số MACD, nâng cao độ nhạy của chỉ số
- Tăng khả năng đánh giá xu hướng, tránh các tín hiệu giả tạo từ thị trường rung động
- Kết hợp với chỉ số biến động để đánh giá biến động của thị trường, điều chỉnh điểm dừng lỗ
Tóm tắt
Chiến lược này sử dụng chỉ số kết hợp hai đường ngang của MACD cổ điển để đánh giá khoảng mua quá mức, tạo ra tín hiệu giao dịch, đồng thời giới thiệu số lượng nắm giữ động và thiết kế điểm dừng lỗ của giá thấp nhất ngày trước, thu được các đặc điểm dao động ngắn của giá cổ phiếu, ý tưởng chiến lược tổng thể rõ ràng và dễ hiểu, đáng để kiểm tra và tối ưu hóa hơn nữa.
Source
Pine
/*backtest
start: 2023-12-10 00:00:00
end: 2023-12-13 02:00:00
period: 5m
basePeriod: 1m
exchanges: [{"eid":"Futures_Binance","currency":"BTC_USDT"}]
*/

//@version=2
// macd/cam v1 strategizing Chris Moody Macd indicator https://www.tradingview.com/script/OQx7vju0-MacD-Custom-Indicator-Multiple-Time-Frame-All-Available-Options/
// macd/cam v2 changing to macd 5,8,3
// macd/cam v2.1 Strategy parameters
Related strategies
Comment
All comments (0)
No data
- 1