Chiến lược đột phá theo sau

Tổng quan
Ý tưởng chính của chiến lược này là xác định hướng xu hướng trên các khung thời gian lớn hơn và tìm điểm đột phá vào các khung thời gian nhỏ hơn, trong khi điểm dừng lại là theo dõi đường trung bình di chuyển trên các khung thời gian lớn hơn.
Nguyên tắc chiến lược
Chiến lược này được đánh giá dựa trên ba chỉ số chính:
Thứ nhất, tính toán trung bình di chuyển đơn giản X ngày của một chu kỳ dài (như đường hằng ngày) và chỉ cho phép mua khi trung bình di chuyển đó ở vị trí giá. Điều này có thể được sử dụng để xác định hướng xu hướng tổng thể và tránh các giai đoạn biến động giao dịch.
Thứ hai, tính toán giá Swing High cao nhất trong một chu kỳ ngắn hơn (ví dụ như 5 ngày), kích hoạt tín hiệu mua khi giá vượt qua mức cao nhất đó. Ở đây kết hợp với tham số chu kỳ lb để tìm điểm phá vỡ phù hợp.
Thứ ba, thiết lập một đường dừng lỗ. Sau khi vào vị trí, đường dừng lỗ sẽ bị khóa ở mức giá thấp nhất của lbStop trong một khoảng thời gian nhất định từ mức thấp gần nhất. Đồng thời thiết lập một đường trung bình di chuyển (như đường giao dịch 10 ngày EMA) làm cơ chế thoát ra khỏi vị trí khi giá thấp hơn đường trung bình di chuyển đó.
Chiến lược này cũng đặt giá trị ATR để tránh mua các điểm mở rộng quá mức. Ngoài ra còn có các điều kiện phụ trợ khác như phạm vi thời gian đo lường lại.
Sự tương tác của ba chỉ số trên tạo nên logic cốt lõi của chiến lược này.
Phân tích lợi thế chiến lược
Đây là một chiến lược theo dõi đột phá với một số ưu điểm:
-
Sử dụng hai khung thời gian để tránh bị mắc kẹt trong các đột phá giả của thị trường lắc. Khung thời gian dài để đánh giá xu hướng tổng thể, khung thời gian ngắn để tìm điểm vào cụ thể.
-
Sử dụng điểm đột phá hình thành từ swing high, loại đột phá này có một số tính quán tính và dễ bị theo dõi. Đồng thời xem lại tham số lb có thể được điều chỉnh để tìm kiếm đột phá thực sự hiệu quả.
-
Hạn chế thiệt hại nghiêm ngặt hơn, theo dõi mức thấp gần đây và để lại một khoảng cách đệm nhất định để tránh bị đóng cửa.
-
Sử dụng trung bình di chuyển như một cơ chế thoát, có thể dừng lại một cách linh hoạt tùy theo tình hình.
-
Chỉ số ATR tránh nguy cơ phát hành quá mức.
-
Có thể thiết lập các kết hợp tham số khác nhau để kiểm tra hiệu quả, có nhiều không gian tối ưu hóa.
Phân tích rủi ro
Chiến lược này cũng có một số rủi ro:
-
Khi giá dao động lên và xuống gần đường trung bình di chuyển, dễ bị chuyển đổi vào và ra vị trí nhiều lần. Khi đó, bạn có nguy cơ phải trả phí cao hơn.
-
Khi phá vỡ điểm mua gần với đường trung bình di chuyển, sẽ có rủi ro rút lui lớn hơn. Đây là đặc điểm của chính chiến lược.
-
Khi thị trường không có xu hướng rõ ràng, thời gian giữ vị thế có thể quá dài, đối mặt với rủi ro thời gian.
-
Cần thiết lập các tham số ATR hợp lý. ATR quá nhỏ sẽ làm giảm hiệu quả lọc, quá lớn sẽ làm giảm cơ hội nhập.
-
Cần kiểm tra ảnh hưởng của các tham số lb khác nhau đối với kết quả. Các tham số quá lớn có thể bỏ lỡ một số cơ hội, và các tham số quá nhỏ có thể nhận diện các đột phá giả.
Phương pháp giải quyết rủi ro:
- Điều chỉnh các tham số trung bình di chuyển thích hợp, thêm hiệu ứng lọc.
- Tối ưu hóa tham số ATR và đánh giá bằng thị giác.
- Điều chỉnh lại chu kỳ lb để tìm tham số tối ưu.
- Các nhà đầu tư cũng có thể tạm ngưng giao dịch trong thời gian xảy ra động đất.
Hướng tối ưu hóa chiến lược
Chiến lược này cũng có thể được tối ưu hóa từ các khía cạnh sau:
-
Kiểm tra các kết hợp tham số trung bình di chuyển khác nhau để tìm tham số tối ưu.
-
Thử các thiết lập tham số ATR khác nhau để cân bằng cơ hội nhập và kiểm soát rủi ro.
-
Tối ưu hóa các tham số lb của chu kỳ xem lại để xác định đột phá hiệu quả hơn.
-
Cố gắng thiết lập dừng động, kiểm soát rủi ro theo tỷ lệ biến động và rút tiền.
-
Kết hợp các yếu tố khác như chỉ số khối lượng giao dịch để đánh giá hiệu quả của đột phá.
-
Phát triển các phương pháp để tìm các điểm cực đoan như <, <, > để tham khảo.
-
Cố gắng Machine Learning để đào tạo các tham số để có được tham số tối ưu
Tóm tắt
Chiến lược tổng thể là một chiến lược theo dõi đột phá điển hình. Quyết định khung thời gian kép, Swing High xác định cơ chế thoát ra hai bảo hiểm nhập cảnh, dừng lỗ và trung bình di chuyển, tạo thành một hệ thống logic hoàn chỉnh. Các đặc điểm rủi ro và lợi nhuận của chiến lược được xác định rõ ràng, phù hợp với các nhà đầu tư theo dõi loại đường dài trung bình. Mặc dù có một số rủi ro, nhưng có thể giảm mức độ rủi ro bằng cách tối ưu hóa tham số và tối ưu hóa quy tắc.
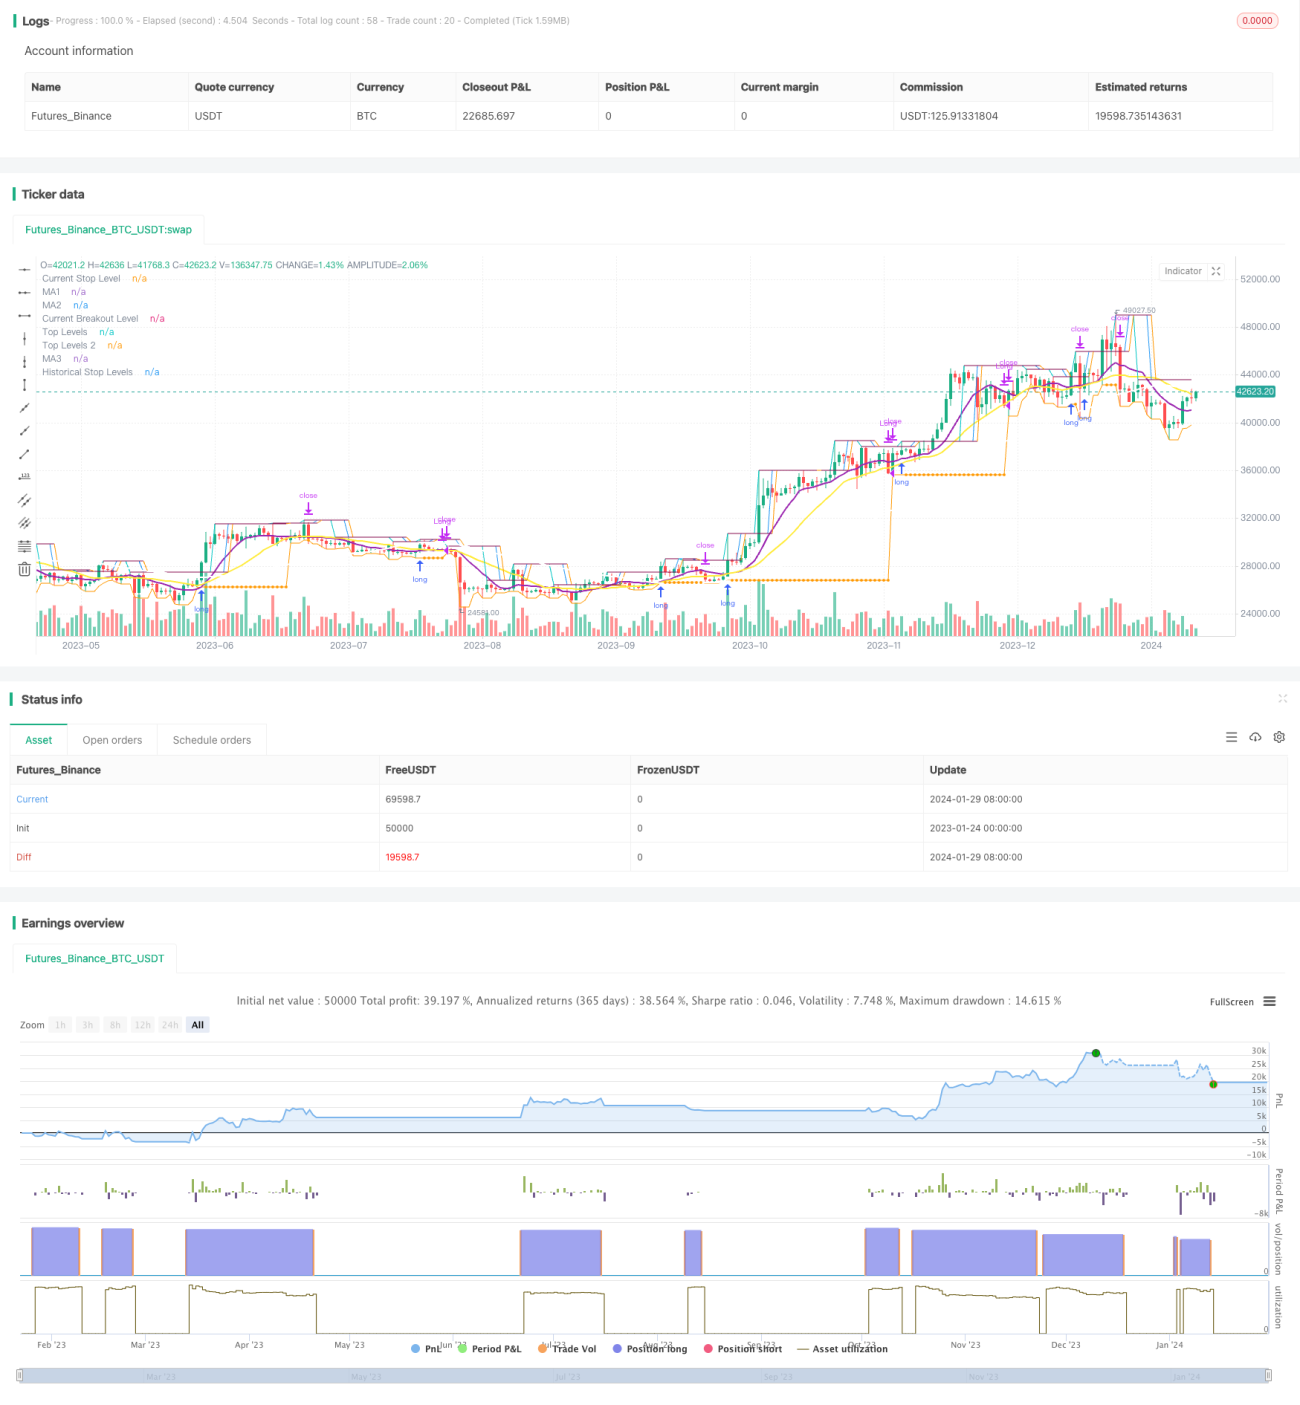
/*backtest
start: 2023-01-24 00:00:00
end: 2024-01-30 00:00:00
period: 1d
basePeriod: 1h
exchanges: [{"eid":"Futures_Binance","currency":"BTC_USDT"}]
*/

// This source code is subject to the terms of the Mozilla Public License 2.0 at https://mozilla.org/MPL/2.0/
// © millerrh

// The intent of this strategy is to buy breakouts with a tight stop on smaller timeframes in the direction of the longer term trend.- 1