Doppelte EMA Golden Cross Handelsstrategie

Überblick
Die Strategie kombiniert eine doppelte EMA-Gold-Kreuzung, einen standardisierten ATR-Noisefilter und einen ADX-Trendindikator, um Händlern ein zuverlässigeres Kaufsignal zu geben. Die Strategie kombiniert mehrere Indikatoren, um falsche Signale zu filtern und zuverlässigere Handelsmöglichkeiten zu identifizieren.
Strategieprinzip
Die Strategie verwendet EMAs mit 8 und 20 Zyklen, um ein doppeltes EMA-Gold-Kreuzsystem zu erstellen. Es erzeugt ein Kaufsignal, wenn ein kurzes EMA ein langes EMA durchquert.
Außerdem wurden mehrere Hilfsindikatoren für die Filterung eingerichtet:
-
14 ATR-Zyklen, standardisiert, um zu geringe Preisschwankungen auf dem Markt zu filtern.
-
14 Perioden ADX, die Stärke des Trends. Nur bei starken Trends werden Handelssignale berücksichtigt.
-
14 Zyklusvolumen SMA, Filter für Zeitpunkte mit geringem Volumen.
-
Der 4/14-Zyklus-Super-Trend-Indikator, der die Richtung des freien Marktes bestimmt.
Die EMA-Gold-Kreuzung löst letztendlich ein Kaufsignal aus, nachdem die Trendrichtung, die ATR-Standardisierung, die ADX-Werte und die Umsatzbedingungen erfüllt wurden.
Strategische Vorteile
-
Mehrindikator-Kombination mit hoher Zuverlässigkeit
Die Strategie integriert mehrere Indikatoren wie EMA, ATR, ADX und Super Trend, um ein stärkeres Signalfiltersystem mit hoher Zuverlässigkeit zu bilden.
-
Die Parameter sind räumlich einstellbar
ATR Standardisierte Wertminderung, ADX Wertminderung, Haltedauer und andere Parameter können entsprechend der tatsächlichen Situation optimiert angepasst werden, und die Strategie ist flexibler.
-
Unterscheidung zwischen freien Märkten
Verwenden Sie verschiedene Parameterkriterien, um überflüssige Märkte anhand der Super Trend-Indikatoren zu beurteilen und Verluste zu vermeiden.
Strategisches Risiko
-
Parameter sind schwierig zu optimieren
Die Kombination von Strategieparametern ist komplex, die Optimierung ist schwierig und erfordert eine große Anzahl von Rückprüfungen, um die optimalen Parameter zu finden.
-
Fehler im Indikator lösen Risiken aus
Trotz der Mehrfachfilterung besteht die Gefahr eines Fehltrigers, da der Indikator von Natur aus rückläufig ist. Die Stop-Loss-Theorie muss berücksichtigt werden.
-
Niedrige Handelsfrequenz
Die Strategie wird von mehreren Indikatoren und Schwankungen beeinflusst, was zu einer geringen Handelsfrequenz und möglicherweise zu einer langen Zeit ohne Handel führt.
Richtung der Strategieoptimierung
-
Optimierungsparameterkombinationen
Die optimale Kombination der Indikatorparameter wird durch eine große Menge an Rückmessdaten gefunden.
-
Mehr Maschinelles Lernen
Auf der Grundlage großer Mengen an historischen Daten werden Strategieparameter automatisch optimiert, um die Anpassungsfähigkeit der Strategie zu erreichen.
-
Weitere Marktfaktoren berücksichtigen
Die Strategie ist vielfältig, da sie mehr Indikatoren zur Bestimmung der Struktur des Marktes, der Stimmung usw. enthält.
Zusammenfassen
Die Strategie berücksichtigt Trends, Volatilität und Quantifikationsfaktoren und bildet ein Handelssystem durch mehrere Indikatoren Filterung und Parameter-Anpassung. Die Strategie hat eine hohe Zuverlässigkeit und kann die Handels-Effizienz der Strategie durch weitere Optimierung ihrer Parameter-Kombination und Modellierung verbessern.
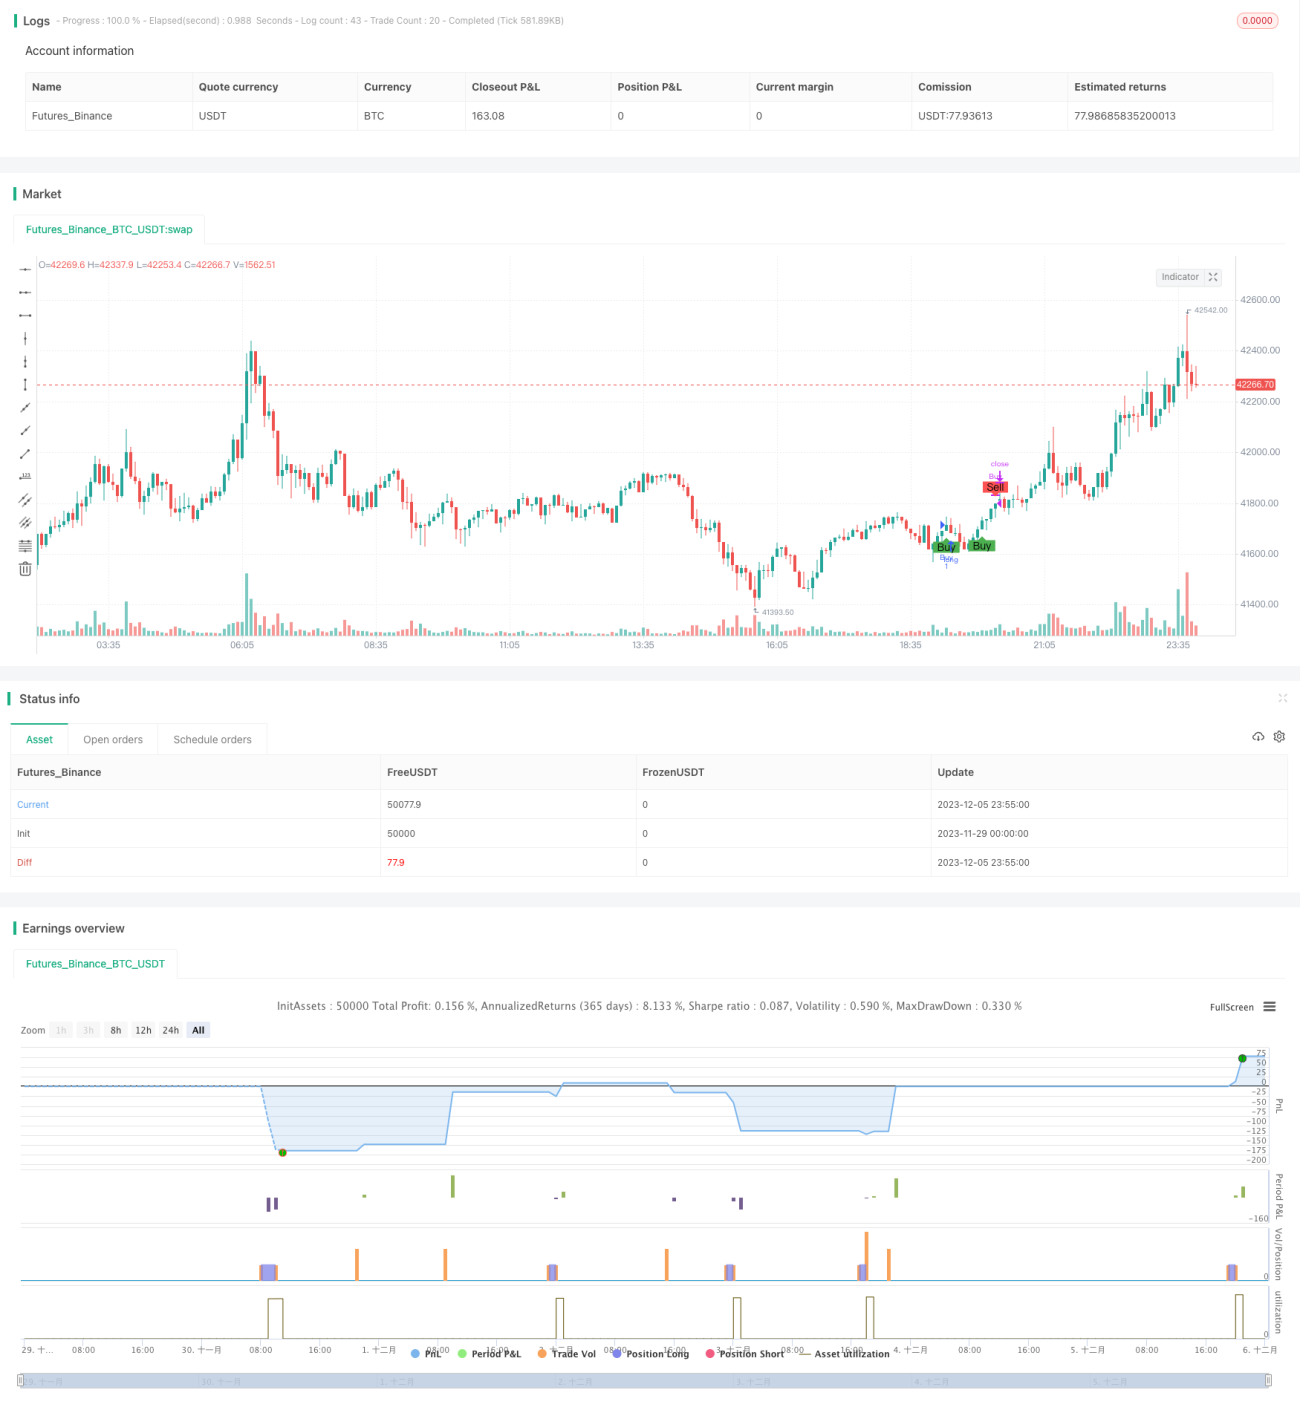
/*backtest
start: 2023-11-29 00:00:00
end: 2023-12-06 00:00:00
period: 5m
basePeriod: 1m
exchanges: [{"eid":"Futures_Binance","currency":"BTC_USDT"}]
*/


//Description:
//This strategy is a refactored version of an EMA cross strategy with a normalized ATR filter and ADX control.
//It aims to provide traders with signals for long positions based on market conditions defined by various indicators.- 1