トレンドの信頼に基づくトレンドフォロー戦略

概要
この戦略の主な考えは,可能な限り正確なトレンド追跡戦略を実現することである.この戦略は,過去一定数の閉店価格の<unk>置信度<unk>を計算して,現在の線形トレンドの継続の可能性を判断する.この戦略は,信度が一定のレベルを超えると,進行中の線形トレンドが継続する可能性が高いことを仮定する.
戦略原則
この策略は,通常の線形回帰方法によって過去N回の閉盘価格の線形適合を計算し,その傾斜率kと閉盘価格との偏差基準差σ . を得し,その後,トレンド不信度をk/σ . と定義する.
トレンドの信頼が<unk>多入場<unk>値を超えると,多出場する. <unk>多平仓<unk>値を下回ると,平仓する. 同様に,トレンドの信頼が<unk>空入場<unk>値を下回ると,平仓する.<unk>空平仓<unk>値を超えると,平仓する.
価格の動きが,明らかに線形的なトレンドに従わない場合,その信号をフィルターします.
優位分析
この戦略は,トレンド追跡と統計学の線形回帰の方法と組み合わせて,短期的な価格変動を避け,長期的なトレンドのみに従うことで,取引頻度が低く,勝利率が高くなる.
この策略のパラメータは調整スペースが広く,パラメータを異なる品種と時間周期に適用することで,良い汎用性を達成することができる.
リスク分析
この戦略は,ブートレードされるリスクがあります.価格が明らかにトレンドを逆転すると,戦略は大きな損失を発生します.また,パラメータの不適切な設定は,過度取引または良い取引機会を逃す可能性があります.
損失のリスクを制御するためにストップを設定できます. 同時に,パラメータの選択を慎重に評価し,過度の最適化を避ける必要があります.
最適化の方向
この戦略は,以下の点でさらに改善できます.
-
利潤を固定し,リスクをコントロールするために,ストップ・ロズ,ストップ・ストップ・ロジックを追加します.
-
パラメータを動的に調整できるようにモジュールを最適化します.
-
トレンドの転換点を判断する機械学習モデルを追加し,戦略の勝利率をさらに向上させる
-
異なる品種と時間帯の適応性を試し,汎用性を向上させる
要約する
この戦略は,全体として,長期トレンドをベースに,リスクを制御する量化戦略である.これは,トレンド追跡と線形回帰の方法を融合し,ノイズ取引信号をフィルターすることができる.パラメータ調整によって,それは,異なる品種と周期にうまく適応し,研究と改善を重点的に価値ある有効な戦略である.
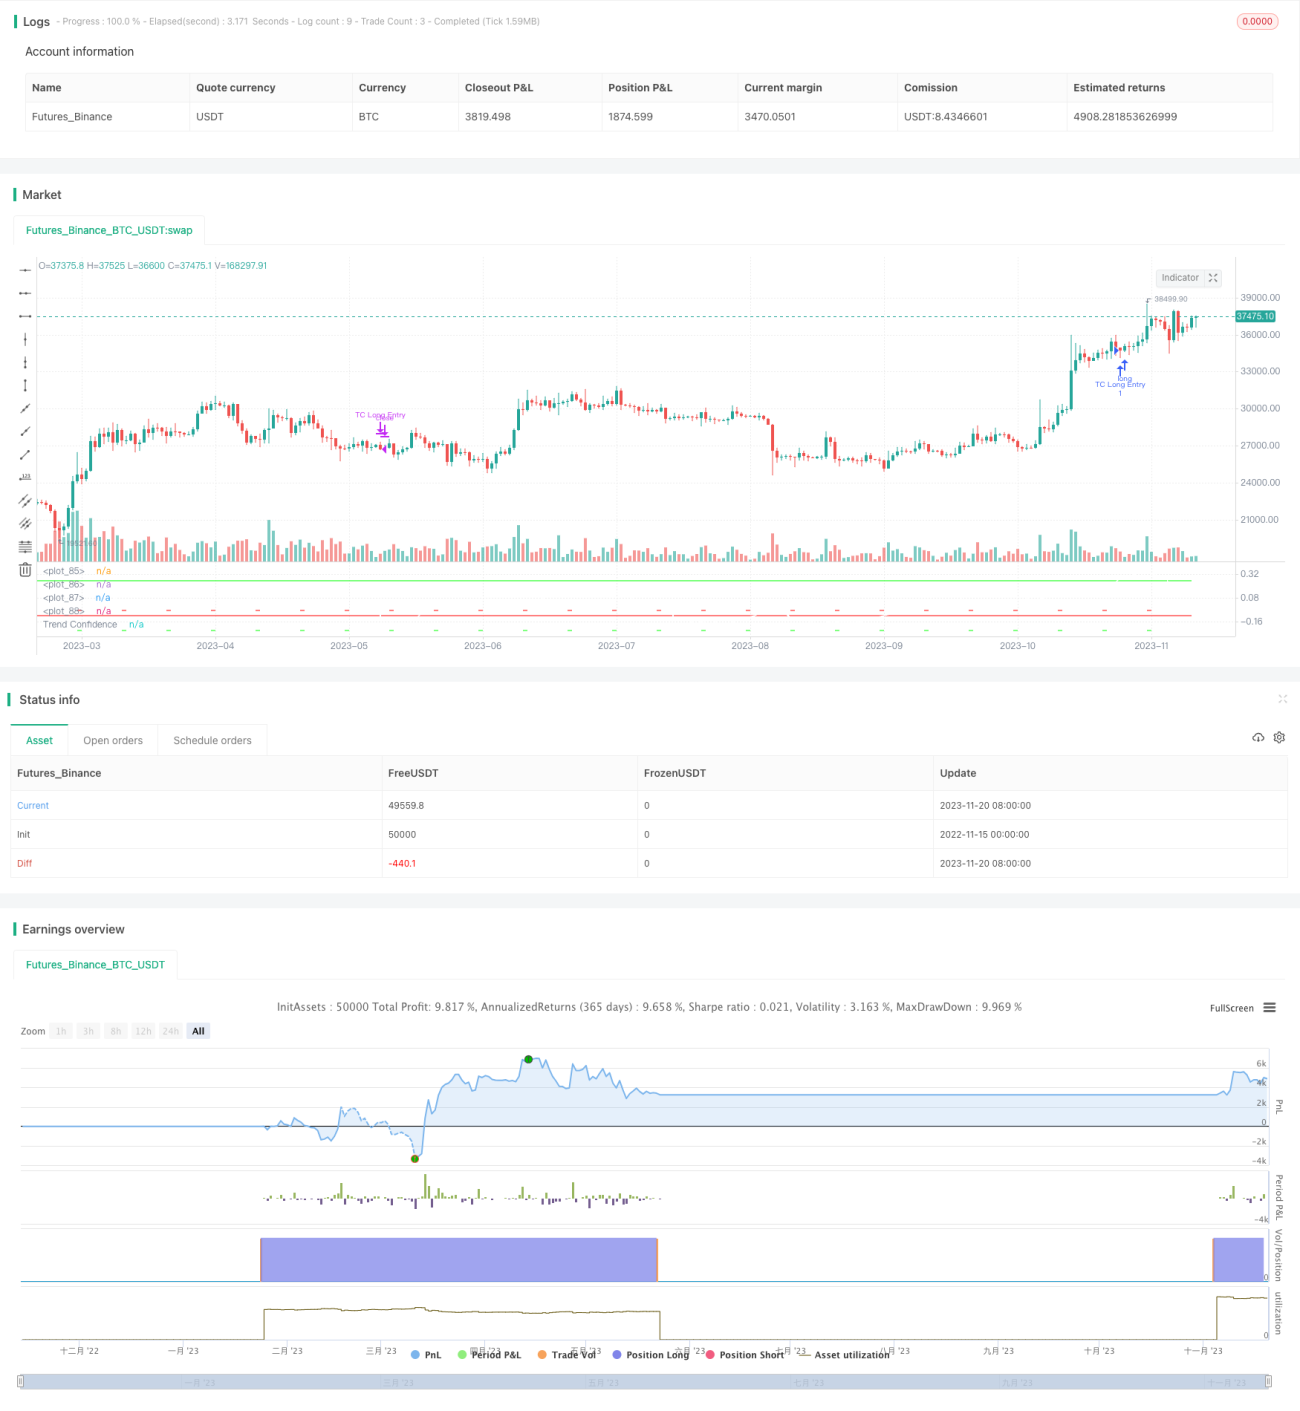
/*backtest
start: 2022-11-15 00:00:00
end: 2023-11-21 00:00:00
period: 1d
basePeriod: 1h
exchanges: [{"eid":"Futures_Binance","currency":"BTC_USDT"}]
*/

// This source code is subject to the terms of the Mozilla Public License 2.0 at https://mozilla.org/MPL/2.0/
// © carefulCamel61097

// ################################################################################################- 1