
この戦略は,双EMAゴールドクロス,標準化されたATRノイズフィルターとADXトレンド指標を組み合わせて,トレーダーにより信頼性の高い買取シグナルを提供することを目的としています.この戦略は,複数の指標を統合して偽のシグナルをフィルターし,より信頼性の高い取引機会を識別します.
この戦略は,8周期および20周期のEMAを使用して双 EMA黄金のクロスシステムを構築する.短周期のEMAが長周期のEMAを横断するときに買い信号を生成する.
政策は,以下の補助指標をフィルターに設定しています.
14周期ATRは,標準化処理を経て,市場の過小価格変動をフィルターします.
14周期ADX,トレンドの強さを識別する. 強いトレンドの時にのみ取引シグナルを考慮する.
14周期取引量SMA,取引量が少ないタイミングをフィルターする.
4/14周期スーパートレンド指数,多空市場方向を判断する.
EMAの金交差は,トレンドの方向,ATRの標準化値,ADX値,取引量条件を満たした後で,最終的に買い信号を誘発する.
この戦略は,EMA,ATR,ADX,Super Trendなどの複数の指標を統合し,指標の相互補完によって強力な信号フィルタリングシステムを形成し,信頼性が高い.
ATR標準化値下げ,ADX値下げ,保有周期などのパラメータは,実際の状況に応じて最適化調整が可能で,戦略の柔軟性が高い.
超トレンド指数で空虚市場を判断し,空虚市場に対して異なるパラメータ基準を使用し,機会を逃さないようにする.
戦略パラメータの組み合わせは複雑で,最適化が困難で,最適なパラメータを見つけるために大量の反省が必要である.
複数のフィルタリングにもかかわらず,指標は本質的に遅滞しているため,誤触発のリスクが残ります. 停止損失理論を十分に考慮する必要があります.
複数の指標と波動の影響で,戦略的取引の頻度は比較的低く,長期にわたって取引なしになる可能性がある.
大量の反測データから,指標パラメータの最適な組み合わせを見つけます.
膨大な歴史的データに基づいて,機械学習アルゴリズムを使用して,戦略のパラメータを自動的に最適化し,戦略の自主性を実現します.
市場構造や情緒などの要因を判断する指標を多く加え,戦略の多様性を豊かにする.
この戦略は,トレンド,波動性,量価の要因を考慮し,多指標のフィルタリングとパラメータの調整によって取引システムを形成します.総合的には,この戦略は信頼性が高く,パラメータの組み合わせとモデリング方法をさらに最適化することで戦略の取引効率を向上させることができます.
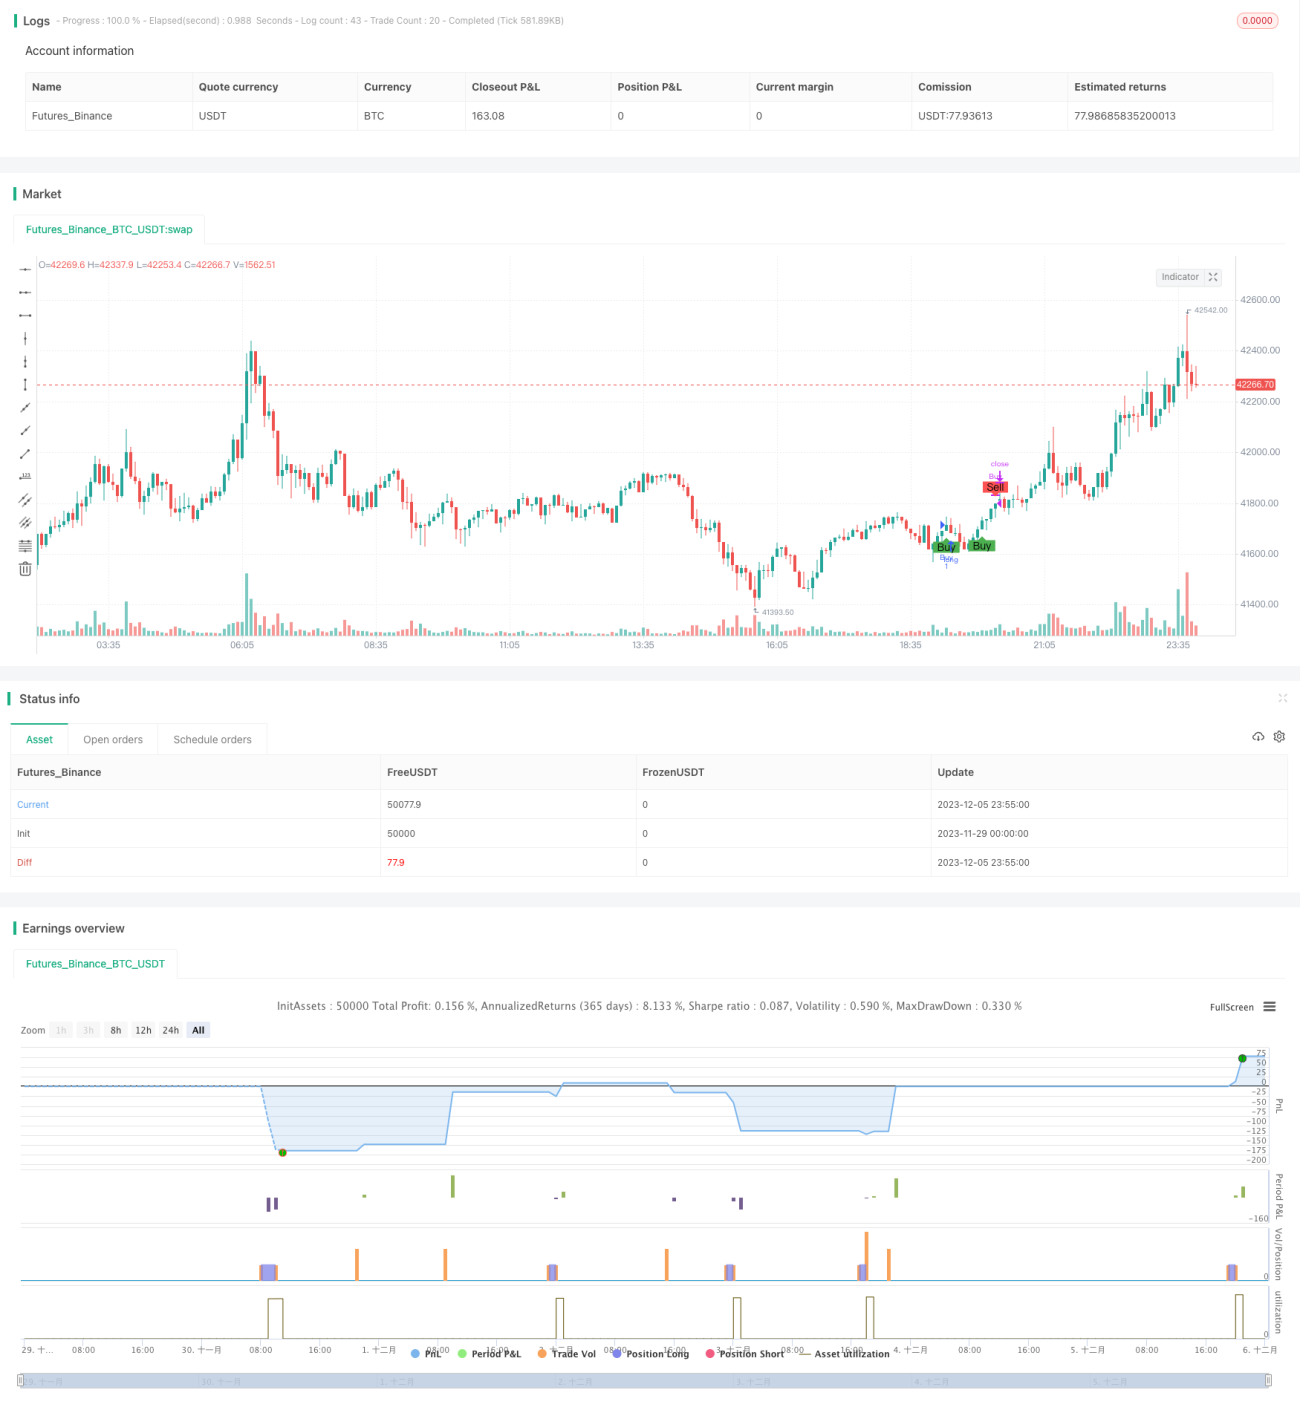
/*backtest
start: 2023-11-29 00:00:00
end: 2023-12-06 00:00:00
period: 5m
basePeriod: 1m
exchanges: [{"eid":"Futures_Binance","currency":"BTC_USDT"}]
*/
//Description:
//This strategy is a refactored version of an EMA cross strategy with a normalized ATR filter and ADX control.
//It aims to provide traders with signals for long positions based on market conditions defined by various indicators.
//How it Works:
//1. EMA: Uses short (8 periods) and long (20 periods) EMAs to identify crossovers.
//2. ATR: Uses a 14-period ATR, normalized to its 20-period historical range, to filter out noise.
//3. ADX: Uses a 14-period RMA to identify strong trends.
//4. Volume: Filters trades based on a 14-period SMA of volume.
//5. Super Trend: Uses a Super Trend indicator to identify the market direction.
//How to Use:
//- Buy Signal: Generated when EMA short crosses above EMA long, and other conditions like ATR and market direction are met.
//- Sell Signal: Generated based on EMA crossunder and high ADX value.
//Originality and Usefulness:
//This script combines EMA, ATR, ADX, and Super Trend indicators to filter out false signals and identify more reliable trading opportunities.
//USD Strength is not working, just simulated it as PSEUDO CODE: [close>EMA(50)]
//Strategy Results:
//- Account Size: $1000
//- Commission: Not considered
//- Slippage: Not considered
//- Risk: Less than 5% per trade
//- Dataset: Aim for more than 100 trades for sufficient sample size
//Note: This script should be used for educational purposes and should not be considered as financial advice.
//Chart:
//- The script's output is plotted as Buy and Sell signals on the chart.
//- No other scripts are included for clarity.
//- Have tested with 30mins period
//- You are encouraged to play with parameters, let me know if you
//@version=5
strategy("Advanced EMA Cross with Normalized ATR Filter, Controlling ADX", shorttitle="ALP V5", overlay=true )
// Initialize variables
var bool hasBought = false
var int barCountSinceBuy = 0
// Define EMA periods
emaShort = ta.ema(close, 8)
emaLong = ta.ema(close, 20)
// Define ATR parameters
atrLength = 14
atrValue = ta.atr(atrLength)
maxHistoricalATR = ta.highest(atrValue, 20)
minHistoricalATR = ta.lowest(atrValue, 20)
normalizedATR = (atrValue - minHistoricalATR) / (maxHistoricalATR - minHistoricalATR)
// Define ADX parameters
adxValue = ta.rma(close, 14)
adxHighLevel = 30
isADXHigh = adxValue > adxHighLevel
// Initialize risk management variables
var float stopLossPercent = na
var float takeProfitPercent = na
// Calculate USD strength
// That's not working as usd strenght, since I couldn't manage to get usd strength
//I've just simulated it as if the current close price is above 50 days average (it's likely a bullish trend), usd is strong (usd_strenth variable is positive)
usd_strength = close / ta.ema(close, 50) - 1
// Adjust risk parameters based on USD strength
if (usd_strength > 0)
stopLossPercent := 3
takeProfitPercent := 6
else
stopLossPercent := 4
takeProfitPercent := 8
// Initialize position variable
var float positionPrice = na
// Volume filter
minVolume = ta.sma(volume, 14) * 1.5
isVolumeHigh = volume > minVolume
// Market direction using Super Trend indicator
[supertrendValue, supertrendDirection] = ta.supertrend(4, 14)
bool isBullMarket = supertrendDirection < 0
bool isBearMarket = supertrendDirection > 0
// Buy conditions for Bull and Bear markets
buyConditionBull = isBullMarket and ta.crossover(emaShort, emaLong) and normalizedATR > 0.2
buyConditionBear = isBearMarket and ta.crossover(emaShort, emaLong) and normalizedATR > 0.5
buyCondition = buyConditionBull or buyConditionBear
// Sell conditions for Bull and Bear markets
sellConditionBull = isBullMarket and (ta.crossunder(emaShort, emaLong) or isADXHigh)
sellConditionBear = isBearMarket and (ta.crossunder(emaShort, emaLong) or isADXHigh)
sellCondition = sellConditionBull or sellConditionBear
// Final Buy and Sell conditions
if (buyCondition)
strategy.entry("Buy", strategy.long)
positionPrice := close
hasBought := true
barCountSinceBuy := 0
if (hasBought)
barCountSinceBuy := barCountSinceBuy + 1
// Stop-loss and take-profit levels
longStopLoss = positionPrice * (1 - stopLossPercent / 100)
longTakeProfit = positionPrice * (1 + takeProfitPercent / 100)
// Final Sell condition
finalSellCondition = sellCondition and hasBought and barCountSinceBuy >= 3 and isVolumeHigh
if (finalSellCondition)
strategy.close("Buy")
positionPrice := na
hasBought := false
barCountSinceBuy := 0
// Implement stop-loss and take-profit
strategy.exit("Stop Loss", "Buy", stop=longStopLoss)
strategy.exit("Take Profit", "Buy", limit=longTakeProfit)
// Plot signals
plotshape(series=buyCondition, title="Buy Signal", location=location.belowbar, color=color.green, style=shape.labelup, text="Buy")
plotshape(series=finalSellCondition, title="Sell Signal", location=location.abovebar, color=color.red, style=shape.labeldown, text="Sell")