慣性指標取引戦略
概要
慣性指数取引戦略は,相対波動指数 (RVI) に基づくトレンド追跡型アルゴリズム取引戦略である.この戦略は,証券のRVIを計算することによって,市場,株式,または通貨ペアの動力とトレンドを測定する.それは,長期のトレンドの方向を判断し,トレードポジションを確立するシグナルとして使用することができる.
戦略原則
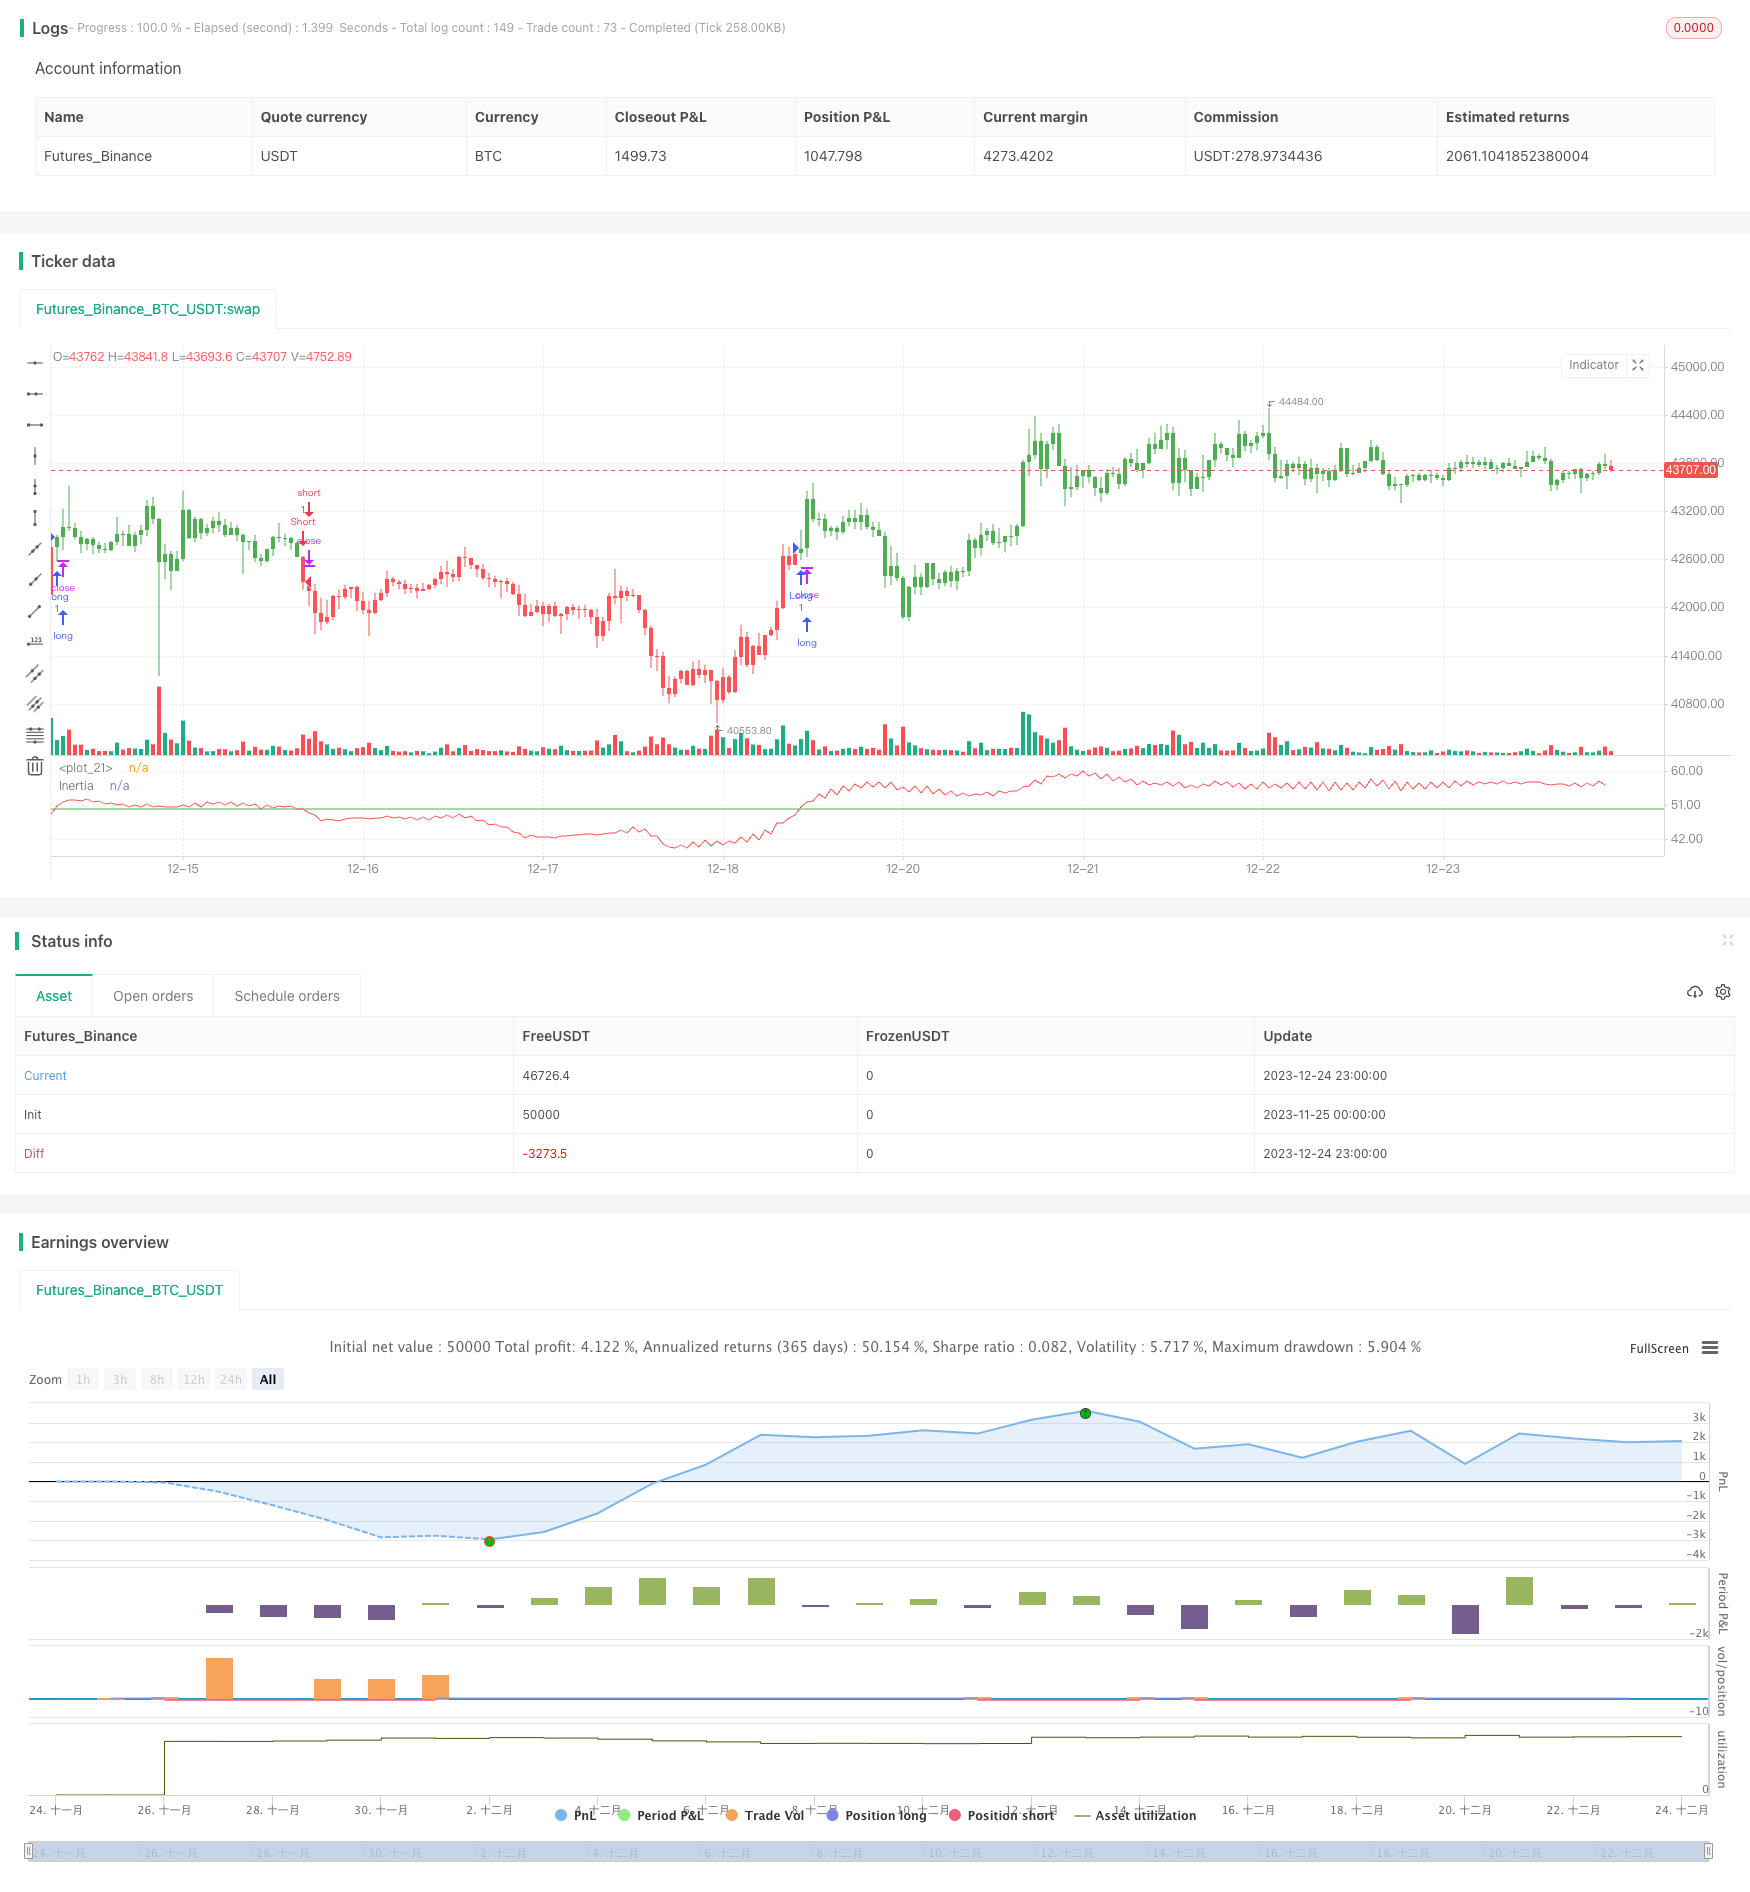
この戦略の核となる指標は慣性指数(Inertia Indicator),0から100までの値域である。50以上の指標は正向慣性であり,50未満の指標は負向慣性である。慣性値が50以上続く限り,長期トレンドを上向きに判断できる.逆に下向きに判断できる。
この指標の計算過程は以下の通りです.
- 指定期間の株価の収束価格の標準差を計算するStdDev
- 今日の閉店価格と昨日の閉店価格を比較して,上方波動uと下方波動dを計算します.
- u と d を計算し,平らにして,nU と nd を得ます.
- nRVI = 100 * nU / (nU + nD) の相対変動指数を計算する
- nRVIに対する指数移動平均は,最終的な慣性値 nRes を得ます.
nResが50より大きいと正向慣性が生じ,買い信号が生じ,50より小さいと負向慣性が生じ,売り信号が生じます.
優位分析
この戦略の最大の利点は,順位を順調に把握し,市場のトレンドを捉え,変動の際の頻繁なポジション開設を避けることである.また,比較的単純な指標計算,計算リソースの要求が低いため,アルゴリズム取引に適している.
リスク分析
この戦略の最大のリスクは,指標自体が遅滞していることであり,ターニングポイントを100%捕獲することができないことです.これは,ポジション開設の最適なタイミングを逃す可能性があります.また,指標のパラメータ設定は,戦略のパフォーマンスに影響を与え,多くの反測を経て最適なパラメータを見つける必要があります.
リスクを軽減するために,他の技術指標または基本指標と組み合わせて使用することを検討し,ポジションの決定により多くの要因を使用することができます.一方,単一の取引のポジション規模を制御する必要があります.
最適化の方向
この戦略は以下の点で最適化できます.
パラメータ最適化 周期パラメータと滑りパラメータの設定を変更し,最適なパラメータの組み合わせを見つける
他の指標と組み合わせる.移動平均,RSIなどの指標と組み合わせて使用し,より多くの要因の意思決定を利用する.
動的ポジション管理 市場状況と指標数値に応じて,動的に各取引のポジションサイズを調整する
自動ストップ・ロスの戦略. ストップ・ロスの位置を設定し,単一取引の最大損失を効果的に制御する.
要約する
慣性指数取引戦略は,全体として比較的シンプルで信頼できるトレンド追跡戦略である.慣性指数に基づいて価格トレンドの方向を判断し,順調にトレードポジションを確立する.パラメータ最適化,指標組み合わせなどの方法によって戦略の効果をさらに高め,量化取引に適したアルゴリズム戦略である.
/*backtest
start: 2023-11-25 00:00:00
end: 2023-12-25 00:00:00
period: 1h
basePeriod: 15m
exchanges: [{"eid":"Futures_Binance","currency":"BTC_USDT"}]
*/

//@version=2
////////////////////////////////////////////////////////////
//  Copyright by HPotter v1.0 23/05/2017
// The inertia indicator measures the market, stock or currency pair momentum and
// trend by measuring the security smoothed RVI (Relative Volatility Index).
// The RVI is a technical indicator that estimates the general direction of the
// volatility of an asset.
// The inertia indicator returns a value that is comprised between 0 and 100.
// Positive inertia occurs when the indicator value is higher than 50. As long as
// the inertia value is above 50, the long-term trend of the security is up. The inertia
// is negative when its value is lower than 50, in this case the long-term trend is
// down and should stay down if the inertia stays below 50.
//
// You can change long to short in the Input Settings
// Please, use it only for learning or paper trading. Do not for real trading.
////////////////////////////////////////////////////////////
strategy(title="Inertia Indicator", shorttitle="Inertia")
Period = input(10, minval=1)
Smooth = input(14, minval=1)
reverse = input(false, title="Trade reverse")
hline(50, color=green, linestyle=line)
xPrice = close
StdDev = stdev(xPrice, Period)
d = iff(close > close[1], 0, StdDev)
u = iff(close > close[1], StdDev, 0)
nU = (13 * nz(nU[1],0) + u) / 14
nD = (13 * nz(nD[1],0) + d) / 14
nRVI = 100 * nU / (nU + nD)
nRes = ema(nRVI, Smooth)
pos = iff(nRes > 50, 1,
	     iff(nRes < 50, -1, nz(pos[1], 0)))
possig = iff(reverse and pos == 1, -1,
          iff(reverse and pos == -1, 1, pos))
if (possig == 1)
    strategy.entry("Long", strategy.long)
if (possig == -1)
    strategy.entry("Short", strategy.short)
barcolor(possig == -1 ? red: possig == 1 ? green : blue )
plot(nRes, color=red, title="Inertia")