
이 전략의 주요 아이디어는 가능한 한 정확한 트렌드 추적 전략을 구현하는 것입니다. 그것은 과거 수개의 종결 가격의 기저 신뢰도 을 계산하여 현재의 선형적 추세가 지속될 가능성을 판단합니다. 이 전략은 신뢰도가 특정 수준을 초과하면 발생하는 선형적 추세가 지속될 가능성이 더 높다고 가정합니다.
이 전략은 일반적인 선형 회귀 방법을 통해 지난 N개의 종결 가격의 선형 적합성을 계산하여, 선형 적합성의 기울기 k와 종결 가격과의 편차 표준 차이는 σ。를 얻으며, 그 다음 경향 신뢰도를 k/σ。로 정의한다.
트렌드 신뢰도가 리본이 더 많은 입점 하락을 달성했을 때, 리본이 더 많은 입점 하락을 달성했을 때, 리본이 더 많은 입점 하락을 달성했을 때, 리본이 더 많은 입점 하락을 달성했을 때, 리본이 더 많은 입점 하락을 달성했을 때, 리본이 더 많은 입점 하락을 달성했을 때, 리본이 더 많은 입점 하락을 달성했을 때, 리본이 더 많은 입점 하락을 달성했을 때, 리본이 더 많은 입점 하락을 달성했을 때, 리본이 더 많은 입점 하락을 달성했을 때, 리본이 더 많은 입점 하락을 달성했을 때, 리본이 더 많은 입점 하락을 달성했을 때, 리본이 더 많은 입점 하락을 달성했을 때, 리본이 더 많은 입점 하락을 달성했을 때, 리본이 더 많은 입점 하락을 달성했을 때, 리본이 더 많은 입점 하락을 달성했을 때, 리본이 더 많은 입지를 달성했다.
이런 식으로, 그것은 명확한 선형적 추세를 따르지 않는 야만적인 가격 변화의 신호를 필터링 할 수 있습니다.
이 전략은 트렌드 추적과 통계학의 선형 회귀 방법을 결합하여 단기 가격 변동을 따르지 않고 장기 트렌드만을 따르기 때문에 거래 빈도가 낮고 승률이 높습니다.
이 전략의 매개 변수 조정 공간이 넓고, 매개 변수를 다른 품종과 시간 주기에 적용하여 좋은 일반화성을 달성할 수 있다.
이 전략은 중도 거래의 위험이 있습니다. 가격이 명백한 추세 반전이 있을 때, 전략은 큰 손실을 초래합니다. 또한, 잘못된 매개 변수 설정은 과도한 거래 또는 좋은 거래 기회를 놓치게 할 수 있습니다.
손실 위험을 제어하기 위해 스톱로스를 설정할 수 있다. 동시에, 과잉 최적화를 피하기 위해 파라미터의 선택을 신중하게 평가해야 한다.
이 전략은 다음과 같은 부분에서 더 개선될 수 있습니다.
이윤을 고정하고 위험을 통제하기 위해 스톱 로직을 추가합니다.
매개 변수를 추가하여 매개 변수를 동적으로 조정할 수 있도록 최적화 모듈에 적응합니다
트렌드 역점을 판단하는 기계 학습 모델을 추가하여 전략의 승률을 더욱 높여줍니다.
다양한 품종과 시간적 적응력을 시험하고, 범용성을 높여라
이 전략은 전반적으로 장기적인 추세에 기반한, 위험을 제어하는 정량적인 전략이다. 그것은 추세 추적과 선형 회귀 방법을 결합하여, 노이즈 트레이딩 신호를 필터링할 수 있다. 매개 변수를 조정함으로써, 그것은 다양한 품종과 주기에 잘 적응할 수 있으며, 연구와 개선을 위한 가치가 있는 효과적인 전략이다.
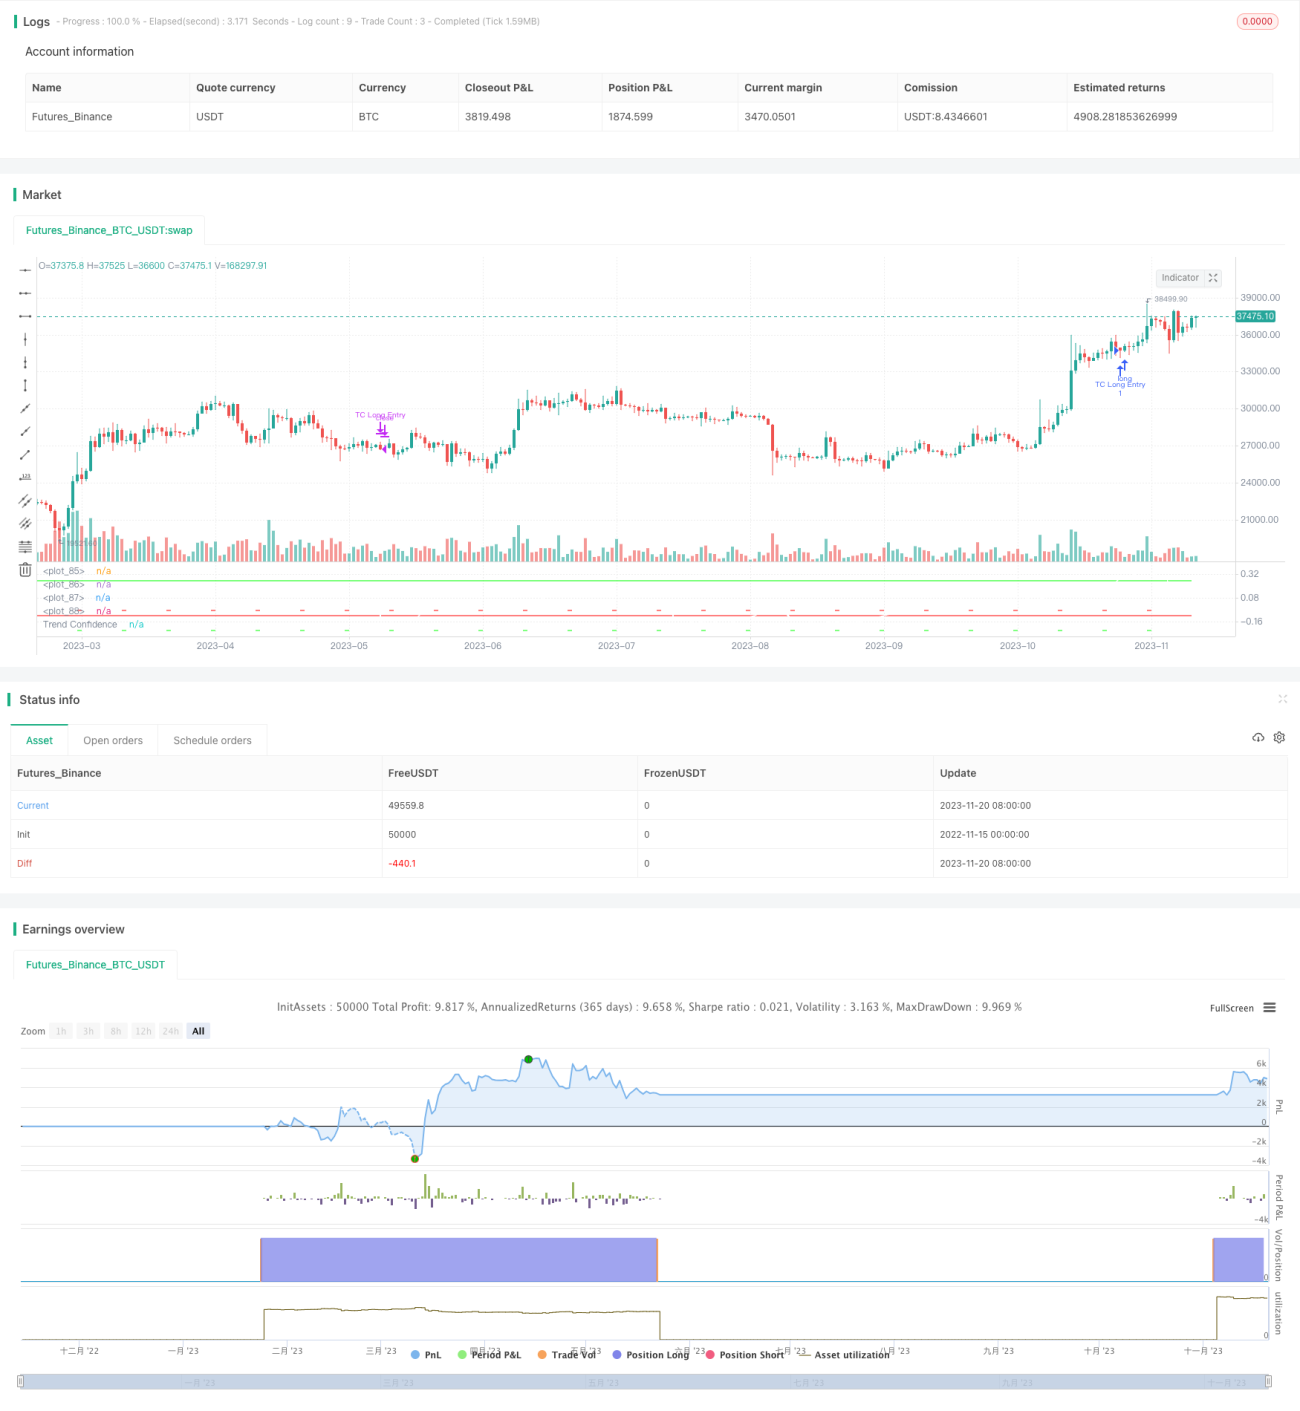
/*backtest
start: 2022-11-15 00:00:00
end: 2023-11-21 00:00:00
period: 1d
basePeriod: 1h
exchanges: [{"eid":"Futures_Binance","currency":"BTC_USDT"}]
*/
// This source code is subject to the terms of the Mozilla Public License 2.0 at https://mozilla.org/MPL/2.0/
// © carefulCamel61097
// ################################################################################################
// "This is a trend following strategy that performed very well on the past 5 years"
// "Intended to be used on BTC-USDT, 4hr timeframe"
// "A factor 2 Leverage can be added by changing Order Size to 200% of equity"
// "Higher leverage is not recommended due to big drawdowns"
// "Also seems to work on 1D timeframe, although ideal parameters may be different"
// "Also seems to work on ETH-USDT and some other altcoins, although ideal parameters are different"
// ################################################################################################
//@version=5
strategy("Trend Following based on Trend Confidence", overlay=false )
// Inputs
source = input(close)
since = input(timestamp('2000-01-01'), title='Start trading interval')
till = input(timestamp('2030-01-01'), title='End trading interval')
length = input(30, title='Length')
longs_on = input.bool(true, title='Longs')
shorts_on = input.bool(true, title='Shorts')
// Parameters for best performance 2018 - 2022
// long_entry = input.float(0.26, step=0.01, title='Long entry threshold')
// long_exit = input.float(-0.10, step=0.01, title='Long exit threshold')
// short_entry = input.float(-0.24, step=0.01, title='Short entry threshold')
// short_exit = input.float(-0.04, step=0.01, title='Short exit threshold')
long_entry = input.float(0.25, step=0.01, title='Long entry threshold')
long_exit = input.float(-0.10, step=0.01, title='Long exit threshold')
short_entry = input.float(-0.25, step=0.01, title='Short entry threshold')
short_exit = input.float(-0.05, step=0.01, title='Short exit threshold')
stop_loss = input.float(10, step=1, title='Stop loss (percentage)') / 100
// Trend Confidence
linreg = ta.linreg(source, length, 0)
linreg_p = ta.linreg(source, length, 0+1)
x = bar_index
slope = linreg - linreg_p
intercept = linreg - x*slope
deviationSum = 0.0
for i = 0 to length-1
deviationSum := deviationSum + math.pow(source[i]-(slope*(x-i)+intercept), 2)
deviation = math.sqrt(deviationSum/(length))
slope_perc = slope / source[0]
deviation_perc = deviation / source[0]
trend_confidence = slope_perc / deviation_perc
// Strategy
in_interval = true
sl_long = strategy.position_avg_price * (1 - stop_loss)
sl_short = strategy.position_avg_price * (1 + stop_loss)
if in_interval and longs_on and ta.crossover(trend_confidence, long_entry)
strategy.entry("TC Long Entry", strategy.long)
strategy.exit("TC Long Exit", stop=sl_long)
if in_interval and longs_on and ta.crossunder(trend_confidence, long_exit)
strategy.close("TC Long Entry")
if in_interval and shorts_on and ta.crossunder(trend_confidence, short_entry)
strategy.entry("TC Short Entry", strategy.short)
strategy.exit("TC Short Exit", stop=sl_short)
if in_interval and shorts_on and ta.crossover(trend_confidence, short_exit)
strategy.close("TC Short Entry")
// Plots
plot(trend_confidence, "Trend Confidence", color.rgb(255, 255, 255))
plot(long_entry, "", color.rgb(0, 255, 0), linewidth=1)
plot(long_exit, "", color.rgb(255, 0, 0), linewidth=1)
plot(short_entry, "", color=bar_index % 10 == 0 ? color.rgb(0, 255, 0) : #00000000, linewidth=1)
plot(short_exit, "", color=bar_index % 10 == 0 ? color.rgb(255, 0, 0) : #00000000, linewidth=1)