더블 EMA 골든 크로스 트레이딩 전략

개요
이 전략은 쌍 EMA 골드 크로스, 표준화된 ATR 노이즈 필터 및 ADX 트렌드 지표를 결합하여 거래자에게 더 신뢰할 수 있는 구매 신호를 제공하고자 합니다. 이 전략은 더 신뢰할 수 있는 거래 기회를 식별하기 위해 거짓 신호를 필터링하는 여러 지표를 통합합니다.
전략 원칙
이 전략은 8주기 및 20주기 EMA를 사용하여 쌍 EMA 골드 크로스 시스템을 구축한다. 짧은 주기 EMA 위에 긴 주기 EMA를 가로질러 구매 신호를 생성한다.
또한, 정책은 다음과 같은 보조 지표들을 필터링하도록 설정했습니다.
-
14주기 ATR, 표준화 처리 후, 시장에서 지나치게 작은 가격 변동을 필터링한다.
-
14주기 ADX, 트렌드를 식별하기 위한 강도. 강한 트렌드에서만 거래 신호를 고려한다.
-
14 주기 거래량 SMA, 거래량이 적은 시점을 필터링하십시오.
-
4/14 주기 슈퍼 트렌드 지표, 다공시장 방향을 판단한다.
트렌드 방향, ATR 표준화 값, ADX 값 및 거래량 조건이 충족되면 EMA 금 교차가 구매 신호를 유발합니다.
전략적 이점
-
다중 지표 조합, 높은 신뢰성
이 전략은 EMA, ATR, ADX, 슈퍼 트렌드 등 여러 지표를 통합하여 지표 상호 보완을 통해 강력한 신호 필터링 시스템을 형성하고 신뢰성이 높습니다.
-
변수는 공간 크기를 조정할 수 있습니다.
ATR 표준화 하락값, ADX 하락값, 포지션 주기 등의 매개 변수는 실제 상황에 따라 최적화 조정할 수 있으며, 전략 유연성이 높다.
-
공백시장을 구분할 수 있다
슈퍼 트렌드 지표를 통해 빈 시장을 판단하고, 빈 시장을 대상으로 다른 파라미터 기준을 사용하여 기회를 놓치지 않도록하십시오.
전략적 위험
-
변수를 최적화하기 어려운 경우
전략적 변수 조합은 복잡하고, 최적화하기는 매우 어렵고, 최적의 변수를 찾기 위해 많은 재검토가 필요합니다.
-
지표의 오류가 위험요소를 유발합니다.
다중 필터링에도 불구하고, 지표의 본질적으로 지연성이 있기 때문에, 잘못된 트리거의 위험이 있습니다.
-
거래 빈도가 낮습니다.
다중 지표와 파동에 영향을 받으면 전략 거래 빈도가 낮아지고 장기간 거래가 없을 수 있습니다.
전략 최적화 방향
-
최적화 변수 모음
대량의 재검토 데이터를 통해 지표 변수의 최적의 조합을 찾는다.
-
더 많은 기계 학습
많은 역사적 데이터를 기반으로, 기계 학습 알고리즘을 사용하여 전략 매개 변수를 자동으로 최적화하여 전략의 적응성을 구현합니다.
-
더 많은 시장 요소를 고려하세요.
시장 구조, 감정, 기타 요소를 판단하는 더 많은 지표와 결합하여 전략의 다양성을 풍부하게합니다.
요약하다
이 전략은 종합적으로 트렌드, 변동성 및 양값 요소를 고려하여 다중 지표 필터링 및 변수 조정으로 거래 시스템을 형성합니다. 종합적으로 볼 때, 이 전략은 신뢰성이 높으며, 변수 조합과 모델링 방식을 추가적으로 최적화하여 전략의 거래 효율성을 향상시킬 수 있습니다.
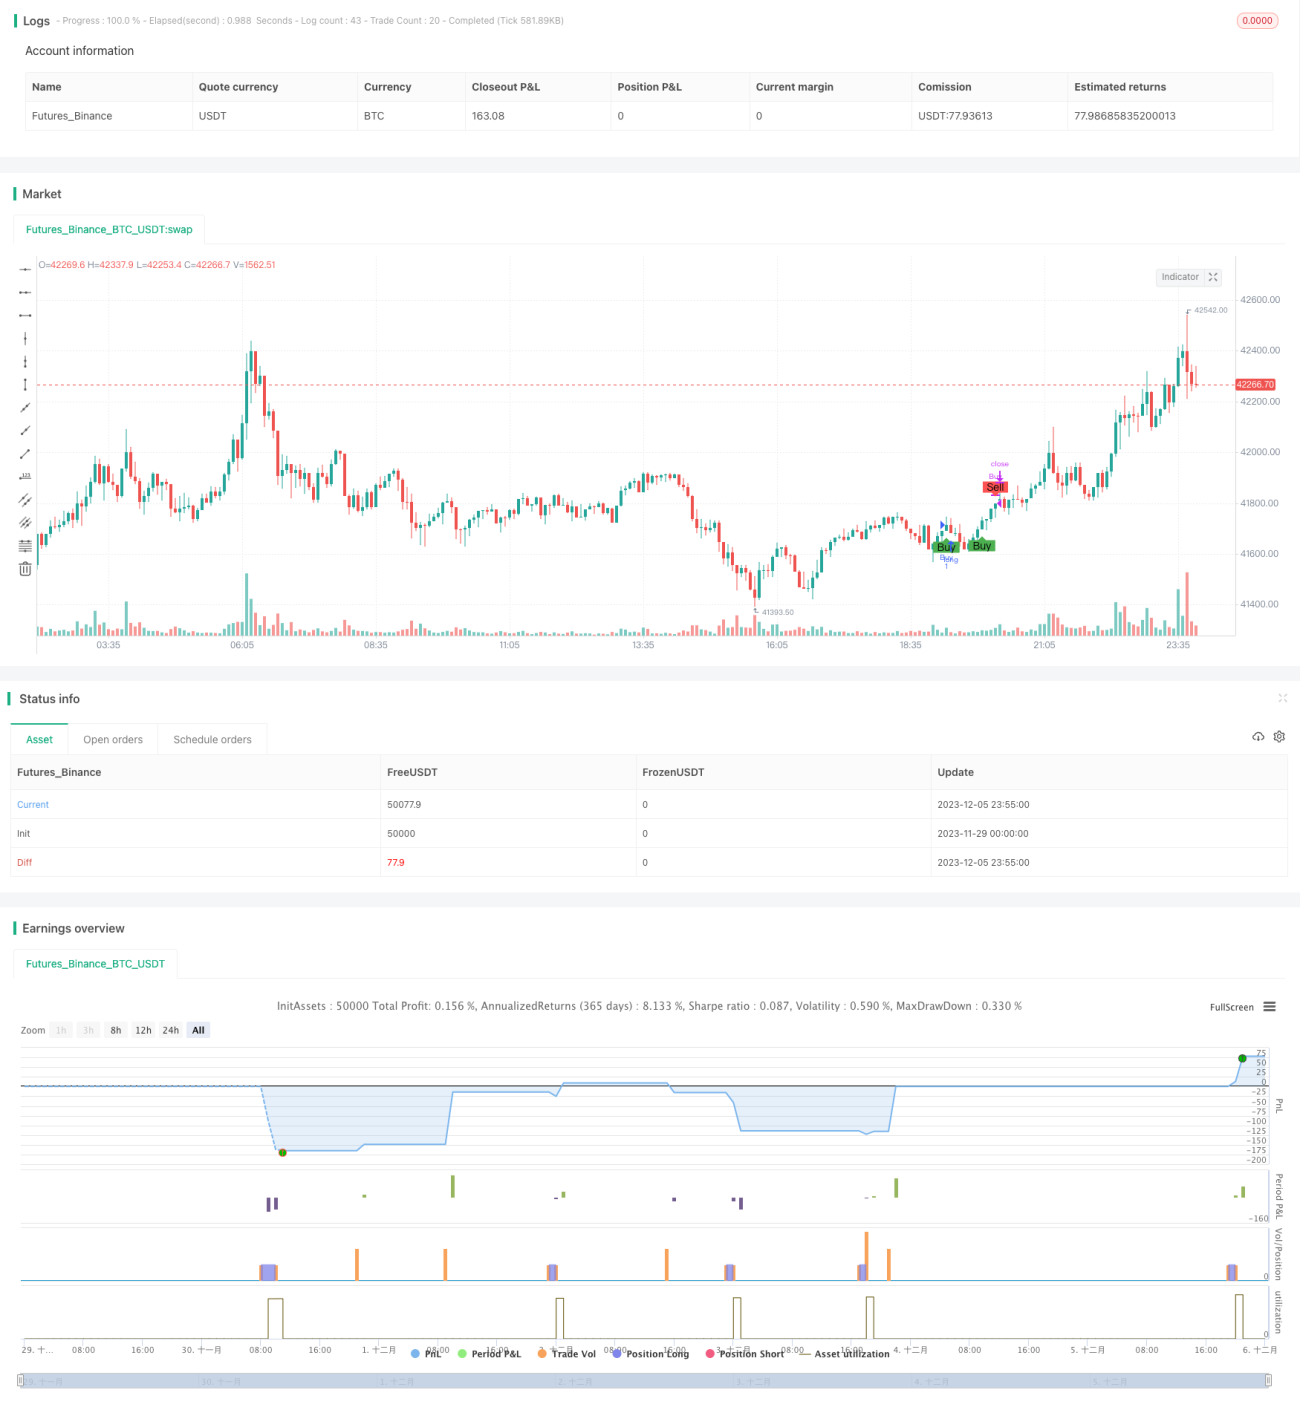
/*backtest
start: 2023-11-29 00:00:00
end: 2023-12-06 00:00:00
period: 5m
basePeriod: 1m
exchanges: [{"eid":"Futures_Binance","currency":"BTC_USDT"}]
*/


//Description:
//This strategy is a refactored version of an EMA cross strategy with a normalized ATR filter and ADX control.
//It aims to provide traders with signals for long positions based on market conditions defined by various indicators.- 1