Strategi Dagangan Golden Cross EMA Berganda

Gambaran keseluruhan
Strategi ini menggabungkan dua EMA Gold Cross, penapis kebisingan ATR standard dan penunjuk trend ADX untuk memberi peniaga isyarat pembelian yang lebih dipercayai. Strategi ini menggabungkan beberapa penunjuk untuk menyaring isyarat palsu dan mengenal pasti peluang perdagangan yang lebih dipercayai.
Prinsip Strategi
Strategi ini menggunakan EMA 8 kitaran dan 20 kitaran untuk membina sistem silang EMA emas ganda. Ia menghasilkan isyarat beli apabila EMA kitaran pendek melintasi EMA kitaran panjang.
Selain itu, beberapa penunjuk tambahan telah disediakan untuk penapisan:
-
14 ATR kitaran, yang disusun secara standard untuk menyaring turun naik harga yang terlalu kecil di pasaran.
-
14 Periode ADX, yang digunakan untuk mengenal pasti kekuatan trend. Hanya dalam trend yang kuat, isyarat perdagangan akan dipertimbangkan.
-
14 kitaran jumlah transaksi SMA, penapisan masa yang lebih kecil jumlah transaksi.
-
Indeks Super Trend 4/14 kitaran, menilai arah pasaran kosong.
EMA Gold Cross akhirnya akan mencetuskan isyarat beli selepas memenuhi arah trend, nilai standard ATR, nilai ADX dan syarat kuantiti.
Kelebihan Strategik
-
Kombinasi pelbagai indikator, kebolehpercayaan yang lebih tinggi
Strategi ini mengintegrasikan pelbagai petunjuk seperti EMA, ATR, ADX, Super Trend, dan lain-lain, membentuk sistem penapisan isyarat yang lebih kuat dengan kebolehpercayaan yang lebih tinggi.
-
Parameter yang boleh disesuaikan
ATR standardisasi nilai terhad, ADX nilai terhad, tempoh pegangan dan lain-lain parameter boleh disesuaikan dengan keadaan sebenar, strategi fleksibiliti yang lebih tinggi.
-
Pasaran kosong yang boleh dibezakan
Untuk menilai pasaran kosong melalui indikator Super Trend, gunakan kriteria parameter yang berbeza untuk pasaran kosong untuk mengelakkan kehilangan peluang.
Risiko Strategik
-
Parameter sukar untuk dioptimumkan
Kombinasi parameter strategi adalah kompleks, pengoptimuman lebih sukar, dan banyak pengulangan diperlukan untuk mencari parameter yang optimum.
-
Kesalahan penunjuk yang mencetuskan risiko
Walaupun terdapat banyak penapisan, terdapat risiko untuk mencetuskan kesilapan kerana sifat indikator yang terbelakang. Perlu dipertimbangkan sepenuhnya teori hentikan kerugian.
-
Perdagangan rendah
Terkesan dengan pelbagai indikator dan gelombang, frekuensi perdagangan strategi akan lebih rendah dan mungkin tidak ada perdagangan dalam jangka masa yang panjang.
Arah pengoptimuman strategi
-
Kombinasi parameter pengoptimuman
Mencari kombinasi optimum parameter penunjuk melalui banyak data pengesanan semula.
-
Menambah pembelajaran mesin
Berdasarkan banyak data sejarah, algoritma pembelajaran mesin digunakan untuk mengoptimumkan parameter strategi secara automatik, untuk mewujudkan fleksibiliti strategi.
-
Mempertimbangkan faktor pasaran yang lebih
Dengan lebih banyak indikator untuk menentukan struktur pasaran, emosi dan lain-lain, ia akan memperkaya pelbagai strategi.
ringkaskan
Strategi ini mengambil kira faktor trend, turun naik dan kuantiti untuk membentuk sistem perdagangan melalui penapisan pelbagai indikator dan penyesuaian parameter. Secara keseluruhan, strategi ini mempunyai kebolehpercayaan yang tinggi, yang dapat meningkatkan kecekapan perdagangan strategi dengan mengoptimumkan lagi kombinasi parameter dan cara pemodelan.
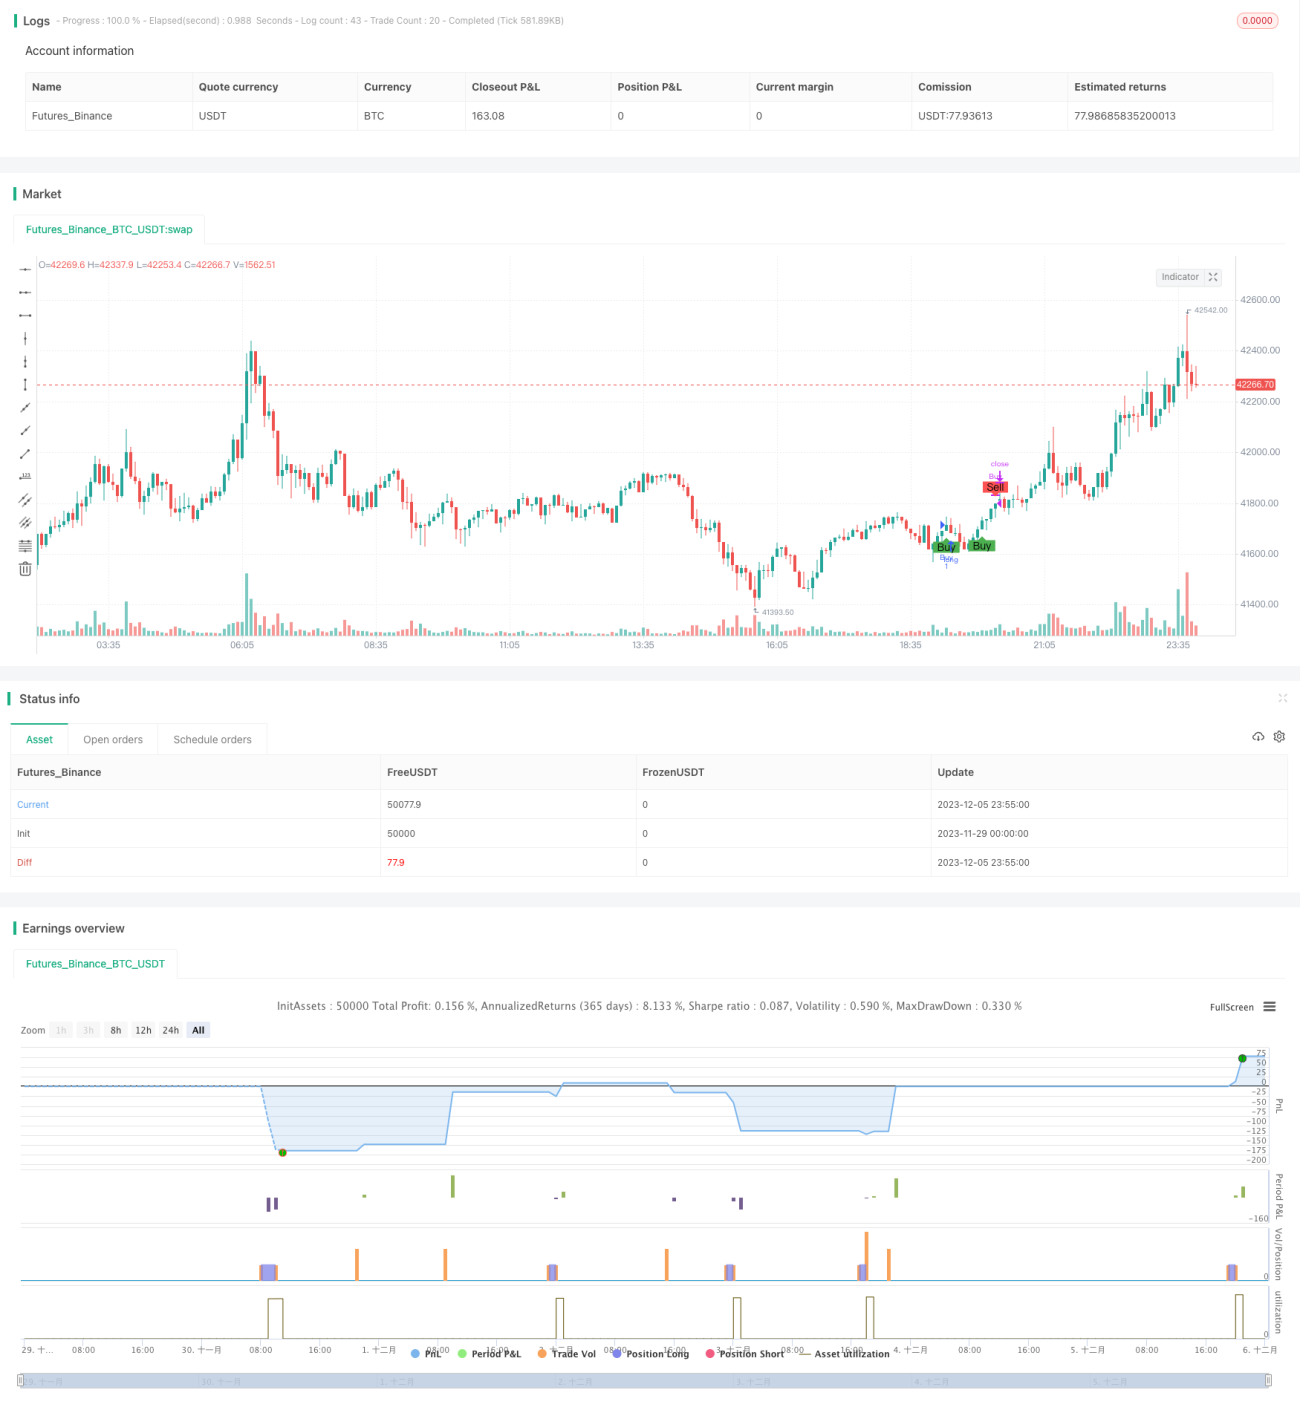
/*backtest
start: 2023-11-29 00:00:00
end: 2023-12-06 00:00:00
period: 5m
basePeriod: 1m
exchanges: [{"eid":"Futures_Binance","currency":"BTC_USDT"}]
*/


//Description:
//This strategy is a refactored version of an EMA cross strategy with a normalized ATR filter and ADX control.
//It aims to provide traders with signals for long positions based on market conditions defined by various indicators.- 1