Chiến lược giao dịch Golden Cross EMA kép

Tổng quan
Chiến lược này kết hợp hai EMA Gold Cross, bộ lọc tiếng ồn ATR tiêu chuẩn và chỉ số xu hướng ADX để cung cấp cho các nhà giao dịch tín hiệu mua đáng tin cậy hơn. Chiến lược này tổng hợp nhiều chỉ số để lọc các tín hiệu giả mạo và xác định các cơ hội giao dịch đáng tin cậy hơn.
Nguyên tắc chiến lược
Chiến lược này sử dụng EMA 8 chu kỳ và 20 chu kỳ để xây dựng hệ thống chéo vàng EMA kép. Khi EMA chu kỳ ngắn vượt qua EMA chu kỳ dài, nó sẽ tạo ra tín hiệu mua.
Ngoài ra, chiến lược cũng có một số chỉ số phụ để lọc:
-
14 chu kỳ ATR, sau khi xử lý tiêu chuẩn hóa, lọc các biến động giá quá nhỏ trên thị trường.
-
14 chu kỳ ADX, được sử dụng để xác định cường độ của xu hướng. Chỉ xem xét tín hiệu giao dịch trong xu hướng mạnh.
-
14 chu kỳ giao dịch SMA, lọc các thời điểm giao dịch nhỏ hơn.
-
Chỉ số Super Trend chu kỳ 4/14, đánh giá xu hướng thị trường đa chiều.
Chỉ sau khi đáp ứng các điều kiện về hướng xu hướng, ATR, ADX và khối lượng giao dịch, EMA Gold Cross sẽ kích hoạt tín hiệu mua.
Lợi thế chiến lược
-
Gói đa chỉ số, độ tin cậy cao
Chiến lược này tích hợp nhiều chỉ số như EMA, ATR, ADX, Super Trend, tạo ra một hệ thống lọc tín hiệu mạnh mẽ và độ tin cậy cao thông qua các chỉ số bổ sung.
-
Các tham số có thể điều chỉnh kích thước không gian
Các tham số như ATR, ADX và thời gian giữ vị trí có thể được điều chỉnh theo tình hình thực tế.
-
Có thể phân biệt thị trường không gian
Sử dụng các tiêu chuẩn tham số khác nhau để đánh giá thị trường trống bằng chỉ số Super Trend để tránh bỏ lỡ cơ hội.
Rủi ro chiến lược
-
Các tham số rất khó để tối ưu hóa
Các tham số chiến lược rất phức tạp, rất khó để tối ưu hóa và cần nhiều phản hồi để tìm các tham số tối ưu.
-
Chỉ số sai kích hoạt rủi ro
Mặc dù có nhiều bộ lọc, nhưng do tính chất của chỉ số bị tụt hậu, vẫn có nguy cơ kích hoạt sai. Cần cân nhắc đầy đủ lý thuyết dừng lỗ.
-
Tỷ lệ giao dịch thấp
Do bị ảnh hưởng bởi nhiều chỉ số và các đợt sóng, tần suất giao dịch chiến lược sẽ thấp hơn và có thể không có giao dịch trong thời gian dài.
Hướng tối ưu hóa chiến lược
-
Gói tham số tối ưu
Tìm ra sự kết hợp tối ưu của các tham số chỉ số thông qua dữ liệu phản hồi lớn.
-
Tăng học máy
Dựa trên một lượng lớn dữ liệu lịch sử, các thuật toán học máy được sử dụng để tự động tối ưu hóa các tham số chiến lược, để thực hiện khả năng thích ứng của chiến lược.
-
Cân nhắc nhiều hơn về thị trường
Nó kết hợp nhiều chỉ số để đánh giá cấu trúc thị trường, cảm xúc và nhiều yếu tố khác nhau để làm phong phú thêm các chiến lược.
Tóm tắt
Chiến lược tổng hợp này xem xét các yếu tố xu hướng, biến động và giá trị, tạo thành hệ thống giao dịch thông qua lọc đa chỉ số và điều chỉnh tham số. Về tổng hợp, chiến lược này có độ tin cậy cao, có thể nâng cao hiệu quả giao dịch của chiến lược bằng cách tối ưu hóa thêm các tham số và mô hình của nó.
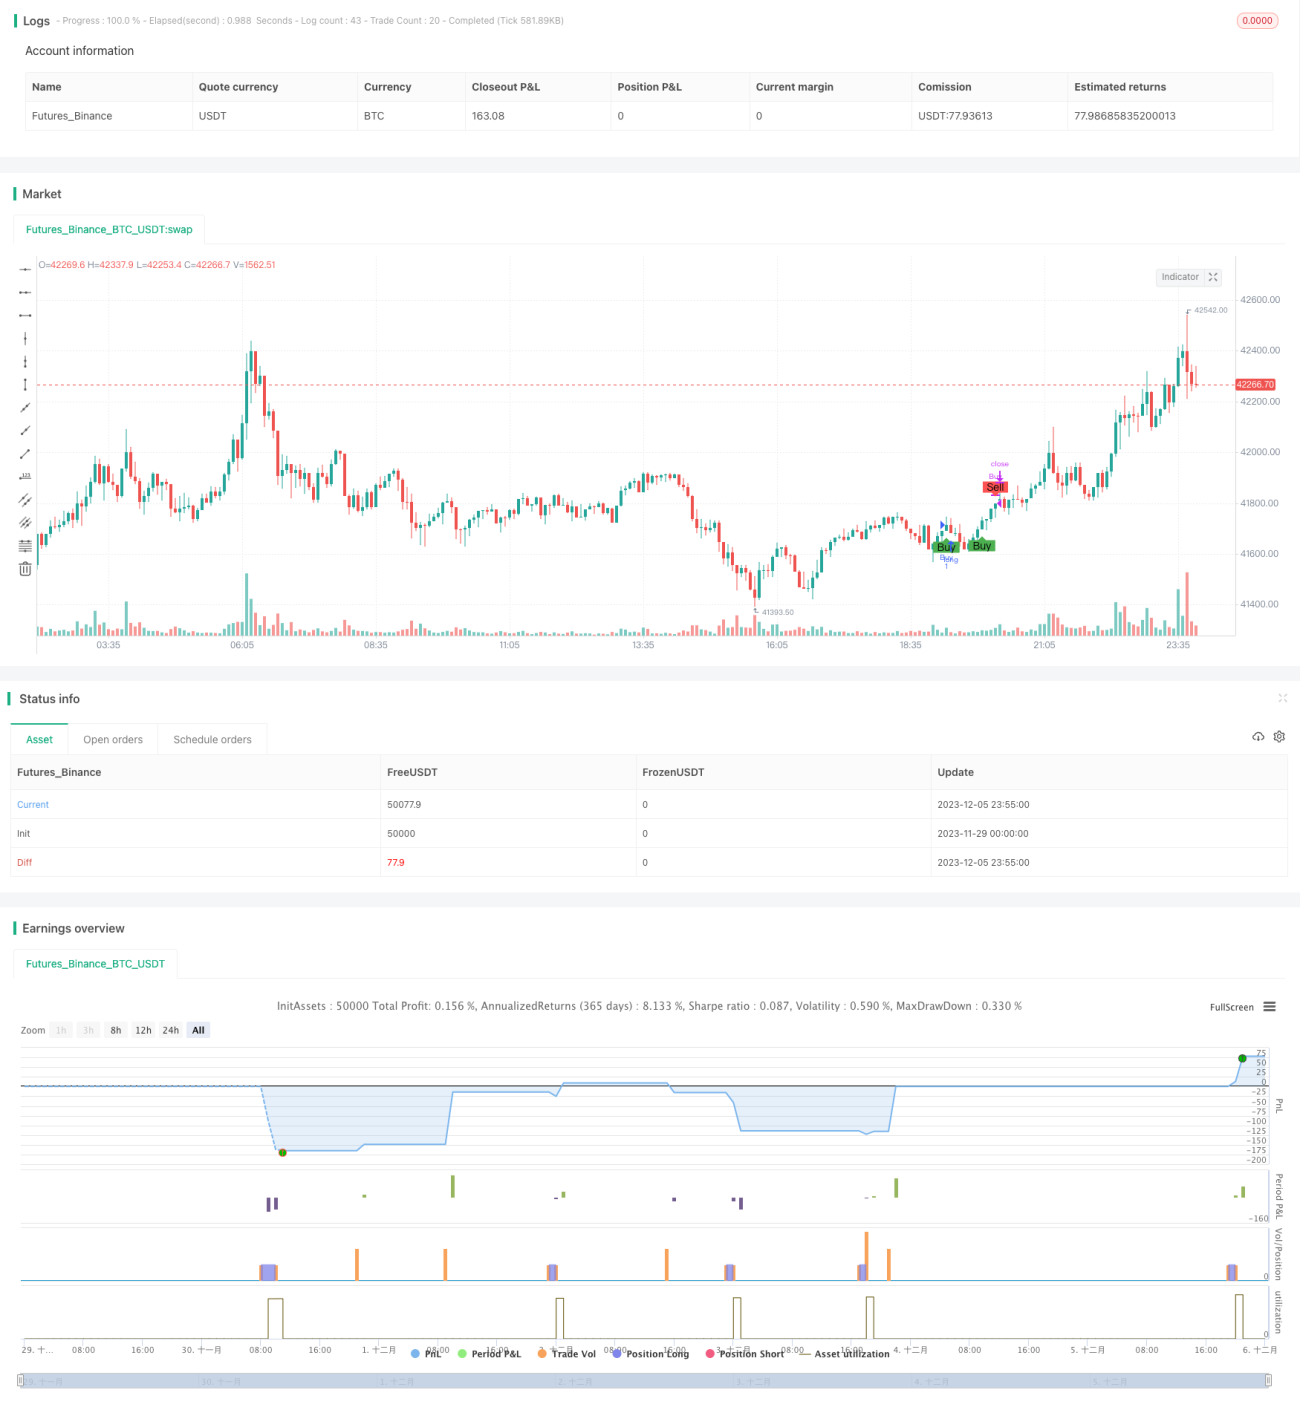
/*backtest
start: 2023-11-29 00:00:00
end: 2023-12-06 00:00:00
period: 5m
basePeriod: 1m
exchanges: [{"eid":"Futures_Binance","currency":"BTC_USDT"}]
*/


//Description:
//This strategy is a refactored version of an EMA cross strategy with a normalized ATR filter and ADX control.
//It aims to provide traders with signals for long positions based on market conditions defined by various indicators.- 1