ダブル移動平均クロスオーバー戦略
概要
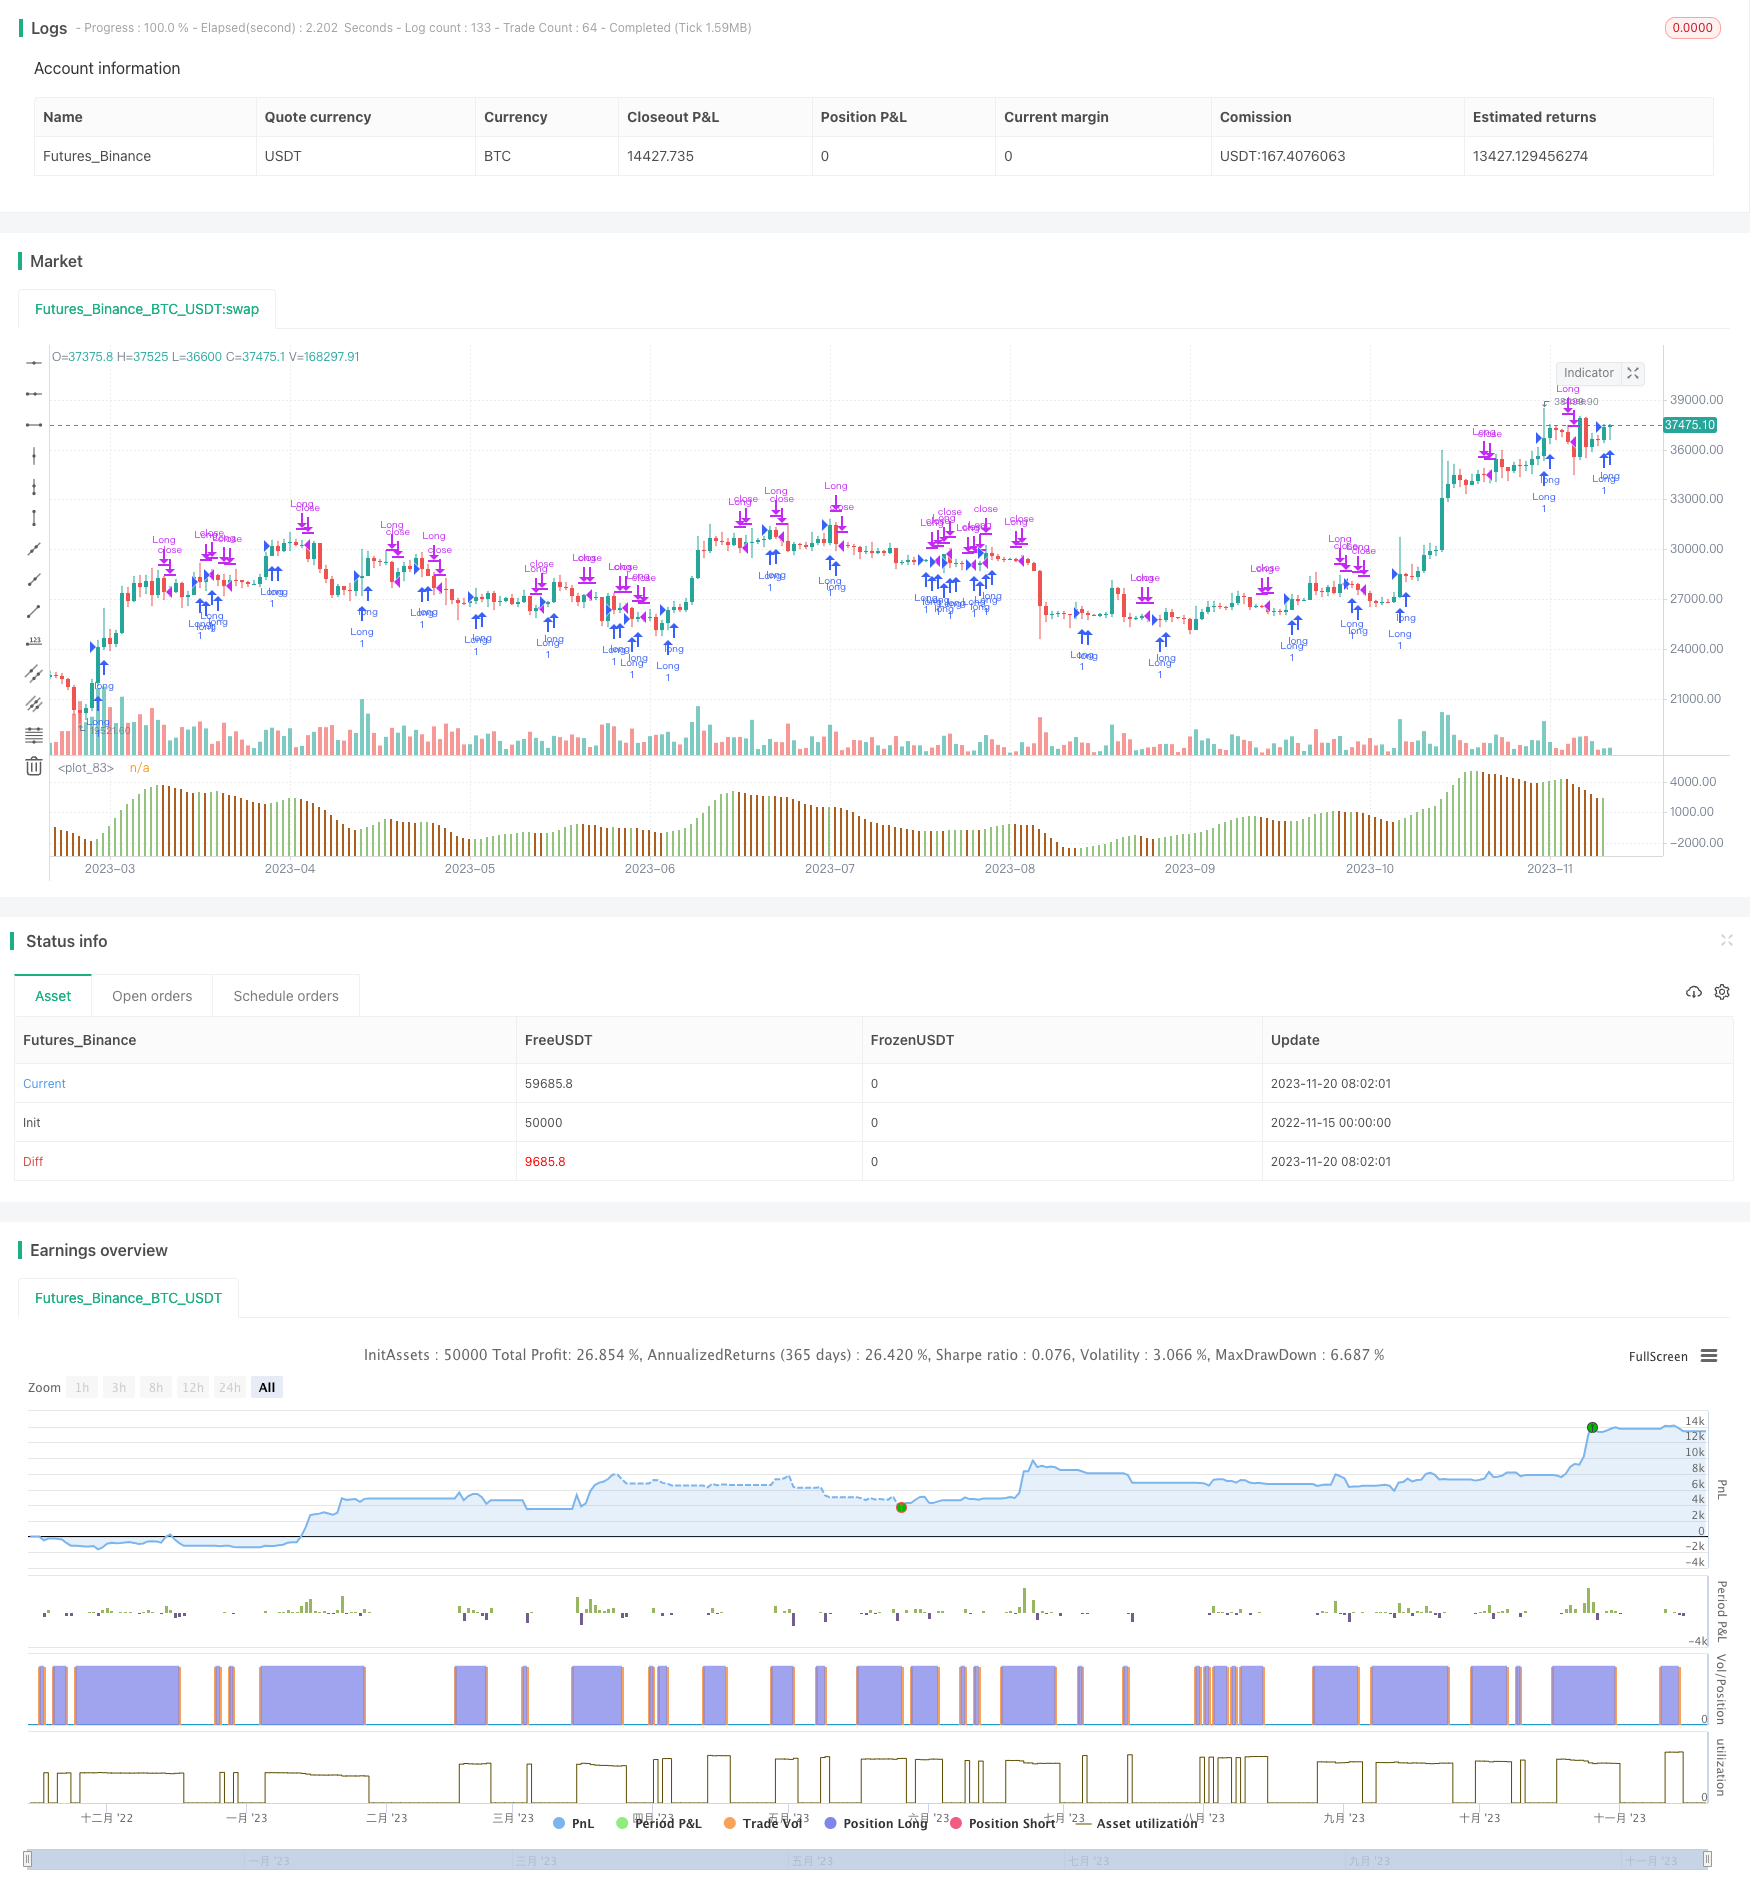
これは,均線指数に基づく簡単な量化取引戦略である. 快速と均線の金叉死叉を使用して,買入と売却のタイミングを判断する. 快線が下方向から慢線を突破すると,買入シグナルを生成し,快線が上方向から下方向から慢線を突破すると,売りシグナルを生成する.
戦略原則
この戦略は主に均線のトレンド追跡機能に基づいています. 快線パラメータは小さいので,価格の変化に素早く反応できます. 慢線パラメータは大きいので,長期のトレンドを表します. 快線は,下から慢線を横切るということは,短期的な動きが逆転し,上昇傾向に入ることを意味します.
具体的には,この戦略では,5日 (快線) と34日 (慢線) の二重均線が定義されている.この2つの均線の値を毎日計算し,快線が下方向から慢線を突破するかどうかを比較する.金叉信号が発生した場合,多めに行い,死叉信号が発生した場合,平仓する.
優位分析
この戦略は,理解しやすく,実行しやすい.他の複雑な戦略に比べて,量化取引の初心者にとっては,適しています.
双均線戦略は,市場騒音を効果的にフィルターし,主要トレンドを捉えます. 快慢均線の日数パラメータを調整することで,異なる周期の市場状況の変化に適応できます.
この戦略には,止損メカニズムも内蔵されている. 価格が逆転し始め,急激な平均線が死叉を起こすと,そのタイミングで止まり,リスクを効果的に制御することができる.
リスク分析
双均線戦略は,止損不調,曲線適合失敗などのリスクが生じることがあります.具体的には,主に以下の問題があります.
平均線が遅滞性がある場合,完全な調節後に信号を発する可能性がある.このとき,利益は損失に変わっている.
振動の状況では,偽信号が複数回発生する可能性があります.この場合,不必要な取引が多くなり,取引コストが増加し,スライドポイントが失われます.
この戦略は,基本的分析と組み合わせた技術的指標に完全に依存している.
位置管理とリスク管理を考慮していない.
最適化の方向
この戦略の利点を最大限に活用し,リスクを減らすために,以下の方法で最適化できます.
トレンド指標と波動指標を組み合わせ,より厳しい入場条件を設定し,偽信号をフィルターする.例えばMACDまたはKDJ指標.
適切なストップメカニズムを追加する.金叉の後に一定の割合で下落した場合にストップする.または新しい高点 (低点) の形成後に一定の幅で下落した場合にストップする.
日数パラメータの組み合わせを最適化して,異なる周期的な価格変化に合わせて調整する。パラメータの組み合わせを最適化して,最適なパラメータを探すことができる。
大盤指数から全体的な動きを判断し,波動的な状況で高頻度の取引を避ける.
トレンド信号の信頼性を検証するために取引量の変化と組み合わせる.例えば,増加には量差突破の条件が必須である.
要約する
双均線戦略は,非常に典型的な量化取引戦略である.それは,単純で直観的で,実行しやすいなどの特性を有しており,量化取引の初心者にとって学習し,掌握するのに適しています.パラメータを継続的にテストし,最適化することで,優れた効果を得ることができます.しかし,この戦略には,遅滞した信号を認識し,偽信号を生成しやすいなどのいくつかの問題があります.これは,補助条件を添加してフィルタリングを行い,リスク管理をよく行うことが必要で,安定した収益性の戦略になります.
/*backtest
start: 2022-11-15 00:00:00
end: 2023-11-21 00:00:00
period: 1d
basePeriod: 1h
exchanges: [{"eid":"Futures_Binance","currency":"BTC_USDT"}]
*/

//@version=2
////////////////////////////////////////////////////////////
// This strategy is a modification to the "Bill Williams, Awesome Oscillator
// (AO) Backtest" strategy (Copyright by HPotter v1.0 29/12/2016)
//
// This version of the strategy by Midnight Mouse. 10/4/2018
//
// DESCRIPTION
//
// This indicator plots the oscillator as a column where periods fit for buying
// are marked as green, and periods fit for selling as orange/brown. If the
// current value of AO (Awesome Oscillator) is > the previous, the period is
// deemed fit for buying and the indicator is marked green. If the AO values is
// not over the previous, the period is deemed fit for selling and the indicator
// is marked orange/brown.
//
// You can change long to short in the Input Settings
//
// Please, use it only for learning or paper trading. Do not for real trading.
////////////////////////////////////////////////////////////

strategy("Awesome Oscillator.MMouse_Lager_BCE")

// === SETTINGS ===

// Strategy start date
FromMonth   = input(defval = 1,    title = "From Month", minval = 1)
FromDay     = input(defval = 1,    title = "From Day",   minval = 1)
FromYear    = input(defval = 2017, title = "From Year",  minval = 2014)

// Strategy settings
nLengthSlow = input(34, minval=1,  title="Length Slow")
nLengthFast = input(5,  minval=1,  title="Length Fast")
allowShorts = input(false,         title="Include Short Trades")
reverse     = input(false,         title="Trade reverse")


// === BODY ===

// Use Heikin-Ashi candles for the buy/sell signal
ha_t        = heikinashi(syminfo.tickerid)
ha_high     = security(ha_t, timeframe.period, high)
ha_low      = security(ha_t, timeframe.period, low)
length      = input( 14 )
price       = open
vrsi        = rsi(price, length)

// Calc (H+L)/2 for each length
xSMA1_hl2   = sma((ha_high + ha_low)/2, nLengthFast)
xSMA2_hl2   = sma((ha_high + ha_low)/2, nLengthSlow)

// Get SMA difference (Fast - Slow)
xSMA1_SMA2  = xSMA1_hl2 - xSMA2_hl2

// Derive the color of the column
cClr = xSMA1_SMA2 > xSMA1_SMA2[1] ? #93c47d : #ad5e1d

// Determine the position to take (Long vs. Short)
pos = iff(xSMA1_SMA2 > xSMA1_SMA2[1],  1, iff(xSMA1_SMA2 < xSMA1_SMA2[1], -1, nz(pos[1], 0)))
possig = iff(reverse and pos == 1, -1, iff(reverse and pos == -1, 1, pos))

// Only apply strategy from the start date
if (time >= timestamp(FromYear, FromMonth, FromDay, 00, 00))
    if (possig == 1)
        // Market is currently fit for a Long position
        strategy.entry("Long", strategy.long)

    if (possig == -1)
        // Market is currently fit for a Short position
        if(allowShorts)
            // Shorts are allowed. Record a Short position
            strategy.entry("Short", strategy.short)
        else
            // Shorts are not allowed. Closec the Long position.
            strategy.close("Long")

// Define the candle colors
//barcolor(possig == -1 ? red :
//         possig ==  1 ? green :
//         blue )

// Plot the oscillator
plot(xSMA1_SMA2, style=columns, linewidth=1, color=cClr)