ダブルEMA移動平均クロスオーバー戦略


作成日: 2023-12-06 18:22:16 最終変更日: 2023-12-06 18:22:16
コピー: 0 クリック数: 680
1
フォロー
1619
フォロワー

ダブルEMA移動平均クロスオーバー戦略

概要

二重EMA平均線交差策略は,一般的なトレンド追跡策略である.この策略は,2つの異なる周期のEMA平均線を使用し,短周期EMA上を長周期EMAを横切るときに買入シグナルを生成し,短周期EMA下を長周期EMAを横切るときに売り出シグナルを生成し,価格トレンドの変化を捕捉する.

戦略原則

この戦略の核心的な論理は,EMA平均線の金叉死叉原理に基づいています.EMA平均線は,価格データを効果的に平らげ,トレンドの方向を提示できます.短期のEMA線は,価格の変化に迅速に反応し,長期のEMA線は,ノイズに対して比較的無感であり,長期のトレンドを反映します.短期のEMAを横断すると,価格上昇勢力の強化信号とみなされ,短期のEMAを横断すると,価格下降勢力の強化信号とみなされます.この原則に基づいて,買入と売却の信号を発信します.

具体的には,この策略は length1 と length2 のパラメータを使用して,二つの EMA の平均線の長さを設定する.demaVal1 は length1 の EMA の平均線であり,demaVal2 は length2 の EMA の平均線である.

demaVal1 = EMA(close, length1)  
demaVal2 = EMA(close, length2)

EMA (() は,EMA平均線を計算する関数である。 demaVal1の demaVal2を穿越すると買信信号 demaCrossoverを生成し,下を通過すると売信信号 demaCrossunderを生成する。戦略は,この2つの信号に基づいて取引指示を発行する。

戦略的優位性

この戦略の利点は以下の通りです.

  1. 戦略の論理は単純で理解しやすい.
  2. 均線交差理論は成熟し,広く適用されている.
  3. 設定可能なパラメータの長さは柔軟で,異なる市場環境に適用されます.
  4. 戦略の効果を最適化パラメータで向上させることができます.

リスクと最適化

この戦略にはいくつかのリスクがあります.

  1. 市場がトレンドでないとき,EMAクロスシグナルは頻繁に偽信号が発生する可能性があります.
  2. デフォルトのパラメータは,すべての品種に適用されない可能性があり,歴史データに基づいてターゲットに最適化する必要があります.

リスクに応じて,以下のように最適化できます.

  1. EMA周期パラメータを異なる周期状況に適応させる.
  2. フィルタリング条件を追加し,偽信号を避ける.例えば,適合優位指標,取引量指標など.
  3. 戦略の効果を向上させるための技術指標であるトレンド,サポートレジスタンス等を組み合わせる.

要約する

二重EMA均線交差策略は,全体としてシンプルで実用的なトレンド追跡策略である.均線交差分析の成熟した理論を継承し,パラメータ調整とフィルタリング条件の最適化を前提に,異なる品種のトレンド取引に適用できる.応用の見通しも良好である.
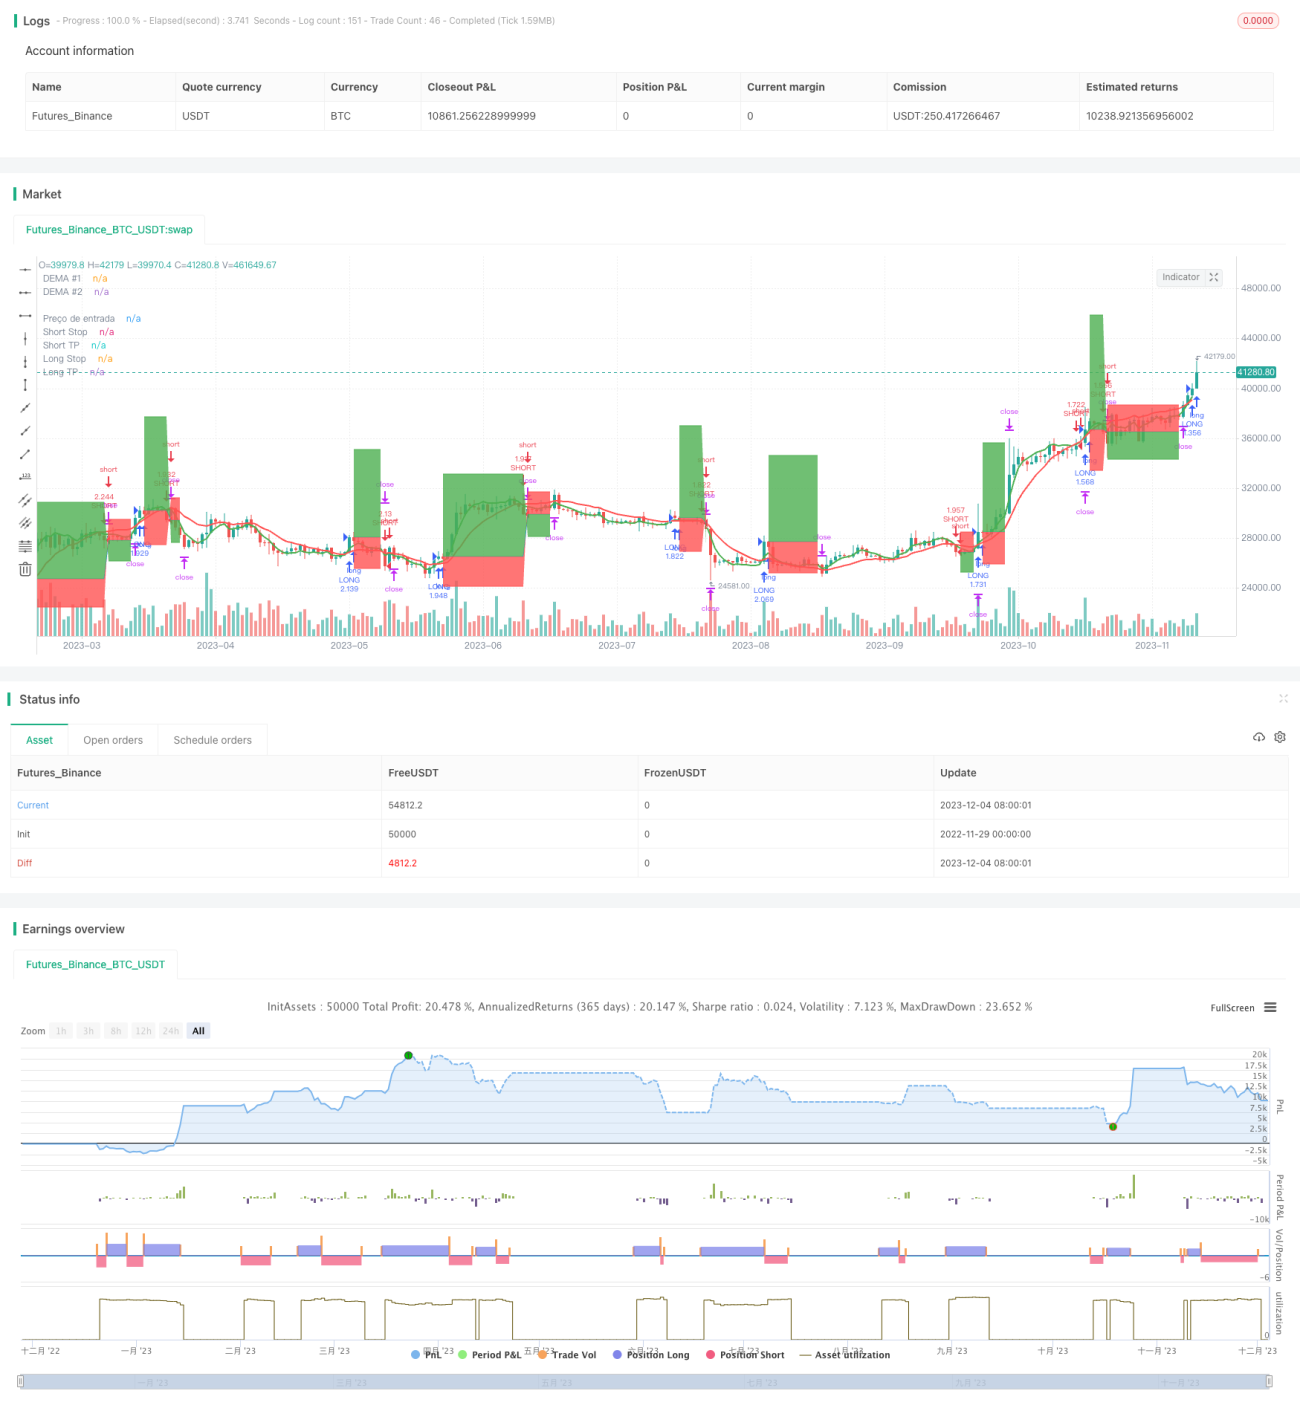
ストラテジーソースコード
/*backtest
start: 2022-11-29 00:00:00
end: 2023-12-05 00:00:00
period: 1d
basePeriod: 1h
exchanges: [{"eid":"Futures_Binance","currency":"BTC_USDT"}]
*/

// This source code is subject to the terms of the Mozilla Public License 2.0 at https://mozilla.org/MPL/2.0/
// © zeguela
//@version=4
strategy(title="ZEGUELA DEMABOT", commission_value=0.063, commission_type=strategy.commission.percent, initial_capital=100, default_qty_value=90, default_qty_type=strategy.percent_of_equity, overlay=true, process_orders_on_close=true)

// Step 1. Script settings

// Input options
srcData = input(title="Source Data", type=input.source, defval=close)

// Length settings
len1 = input(title="Length DEMA #1", type=input.integer, defval=8, minval=1)
len2 = input(title="Length DEMA #2", type=input.integer, defval=24, minval=0)
len3 = input(title="Length DEMA #3", type=input.integer, defval=0, minval=0)

// Step 2. Calculate indicator values
// Function that calculates the DEMA
DEMA(series, length) =>
    if (length > 0)
        emaValue = ema(series, length)
        2 * emaValue - ema(emaValue, length)
    else
        na

// Calculate the DEMA values
demaVal1 = DEMA(srcData, len1)
demaVal2 = DEMA(srcData, len2)
demaVal3 = DEMA(srcData, len3)

// Step 3. Determine indicator signals
// See if there's a DEMA crossover
demaCrossover = if (len2 > 0) and (len3 > 0)
    crossover(demaVal1, demaVal2) and (demaVal3 > demaVal3[1])
else
    if (len2 > 0) and (len3 == 0)
        crossover(demaVal1, demaVal2)
    else
        if (len3 > 0) and (len2 == 0)
            crossover(demaVal1, demaVal3)
        else
            crossover(close, demaVal1)

// Check if there's a DEMA crossunder
demaCrossunder = if (len2 > 0) and (len3 > 0)
    crossunder(demaVal1, demaVal2) and (demaVal3 < demaVal3[1])
else
    if (len2 > 0) and (len3 == 0)
        crossunder(demaVal1, demaVal2)
    else
        if (len3 > 0) and (len2 == 0)
            crossunder(demaVal1, demaVal3)
        else
            crossunder(close, demaVal1)

// Step 4. Output indicator data
// Plot DEMAs on the chart
plot(series=demaVal1, color=color.green, linewidth=2, title="DEMA #1")
plot(series=demaVal2, color=color.red, linewidth=2, title="DEMA #2")
plot(series=demaVal3, color=color.fuchsia, linewidth=2, title="DEMA #3")

//TRAILING STOP CODE
a = input(title="Usar Trailing Stop?", type=input.bool, defval=false)

stopPerlong = input(9.0, title='Stop Loss Long %', type=input.float, group="Stop Loss & Take Profit Settings") / 100
stopPershort = input(6.0, title='Stop Loss Short %', type=input.float, group="Stop Loss & Take Profit Settings") / 100
take1Perlong = input(25.0, title='Take Profit Long % 1', type=input.float, group="Stop Loss & Take Profit Settings") / 100
take1Pershort = input(6.0, title='Take Profit Short % 1', type=input.float, group="Stop Loss & Take Profit Settings") / 100

// Determine stop loss price
longStopPrice  = strategy.position_avg_price * (1 - stopPerlong)
shortStopPrice = strategy.position_avg_price * (1 + stopPershort)
longTake1Price = strategy.position_avg_price * (1 + take1Perlong)
shortTake1Price = strategy.position_avg_price * (1 - take1Pershort)

// Determine trail stop loss prices

longStopPriceTrail = 0.0

longStopPriceTrail := if (strategy.position_size > 0)
    stopValue = close * (1 - stopPerlong)
    max(stopValue, longStopPriceTrail[1])
else
    0

// Determine trailing short price
shortStopPriceTrail = 0.0

shortStopPriceTrail := if (strategy.position_size < 0)
    stopValue = close * (1 + stopPershort)
    min(stopValue, shortStopPriceTrail[1])
else
    999999

//calcular qual stop usar
longStop = a ? longStopPriceTrail : longStopPrice
shortStop = a ? shortStopPriceTrail : shortStopPrice


//calcula o valor do stop e TP pra lançar no alerta
longStopEntrada = close  * (1 - stopPerlong)
shortStopEntrada = close  * (1 + stopPershort) 
longTPEntrada = close * (1 + take1Perlong)
shortTPEntrada = close * (1 - take1Pershort)

//armazena o preço de entrada e valor do SL e TP

price_entryL = 0.0
price_entryL := na(price_entryL) ? na : price_entryL[1]
price_entryS = 0.0
price_entryS := na(price_entryS) ? na : price_entryS[1]
stopL = 0.0
stopL := na(stopL) ? na : stopL[1]
stopS = 0.0
stopS := na(stopS) ? na : stopS[1]
takeL = 0.0
takeL := na(takeL) ? na : takeL[1]
takeS = 0.0
takeS := na(takeS) ? na : takeS[1]

if (demaCrossover)
    price_entryL := close
    stopL := close  * (1 - stopPerlong)
    takeL := close * (1 + take1Perlong)
    
if (demaCrossunder)
    price_entryS := close
    stopS := close  * (1 + stopPershort)
    takeS := close * (1 - take1Pershort)

resultadoL = ((close - price_entryL)/price_entryL) * 100
resultadoLexit = "(SL = 1% e TP = 0,5%)"
resultadoS = ((price_entryS - close)/price_entryS) * 100
resultadoSexit = "(SL = 1% e TP = 0,5)%"
// Make input options that configure backtest date range
_startDate = input(title="Start Date", type=input.integer,
     defval=1, minval=1, maxval=31, group="BackTest Period")
_startMonth = input(title="Start Month", type=input.integer,
     defval=1, minval=1, maxval=12, group="BackTest Period")
_startYear = input(title="Start Year", type=input.integer,
     defval=2018, minval=1800, maxval=2100, group="BackTest Period")

_endDate = input(title="End Date", type=input.integer,
     defval=31, minval=1, maxval=31, group="BackTest Period")
_endMonth = input(title="End Month", type=input.integer,
     defval=12, minval=1, maxval=12, group="BackTest Period")
_endYear = input(title="End Year", type=input.integer,
     defval=2031, minval=1800, maxval=2100, group="BackTest Period")

// Look if the close time of the current bar
// falls inside the date range
_inDateRange = (time >= timestamp(syminfo.timezone, _startYear,
         _startMonth, _startDate, 0, 0)) and
     (time < timestamp(syminfo.timezone, _endYear, _endMonth, _endDate, 0, 0))
  
//Alert configuration     

_alertMessageOpenLong="OpenLong"
_alertMessageCloseLong="CloseLong"
_alertmessageExitLong="ExitLong - TP/SL"

_alertMessageOpenShort="OpenShort"
_alertMessageCloseShort="CloseShort"
_alertMessageExitShort="ExitShort - TP/SL"

if (_inDateRange)
    //ENTER SOME SETUP TRADES FOR TSL EXAMPLE
    if (demaCrossover)
        strategy.entry("LONG", strategy.long, comment = _alertMessageOpenLong)
    if (demaCrossunder)
        strategy.entry("SHORT", strategy.short, comment = _alertMessageOpenShort)
    //EXIT TRADE @ TSL
    if strategy.position_size > 0
        strategy.exit("TP/SL", "LONG", stop=longStop, limit=longTake1Price, comment=_alertmessageExitLong, alert_message=_alertmessageExitLong)
    if strategy.position_size < 0
        strategy.exit("TP/SL", "SHORT", stop=shortStop, limit=shortTake1Price, comment =_alertMessageExitShort, alert_message=_alertMessageExitShort)


//Look & Feel - Plot stop loss and take profit areas
p1=plot(strategy.position_avg_price, color=color.blue, style=plot.style_linebr, linewidth=1, title="Preço de entrada")
p2=plot(series=strategy.position_size > 0 ? longStop : na, color=color.red, style=plot.style_linebr, linewidth=1, title="Long Stop")
p3=plot(series=strategy.position_size > 0 ? longTake1Price : na, color=color.green, style=plot.style_linebr, linewidth=1, title="Long TP")
p4=plot(series=strategy.position_size < 0 ? shortStop : na, color=color.red, style=plot.style_linebr, linewidth=1, title="Short Stop")
p5=plot(series=strategy.position_size < 0 ? shortTake1Price : na, color=color.green, style=plot.style_linebr, linewidth=1, title="Short TP")
fill(p1, p2, color=color.red)
fill(p1, p3, color=color.green)
fill(p1, p4, color=color.red)
fill(p1, p5, color=color.green)

// Insert label with value
stopLossOnLong = "Stop Loss = " + tostring(longStop)
stopLossOnShort = "Stop Loss = " + tostring(shortStop)
takeprofitOnLong = "Take Profit = " + tostring(longTake1Price)
takeprofitOnShort = "Take Profit = " + tostring(shortTake1Price)
precoentrada = "Entrada = " + tostring(strategy.position_avg_price)

var label FinalLabelpriceL = na
var label FinalLabelpriceS = na
var label slFinalLabelL = na
var label slFinalLabelS = na
var label slFinalLabelTPL = na
var label slFinalLabelTPS = na


//Draw entry and stop loss lines and labels

if strategy.position_size > 0   
    
    //write the price above the end of the stoploss line
    slFinalLabelL := label.new(bar_index, longStop, stopLossOnLong, style=label.style_none, size=size.normal, textcolor=color.red)
    slFinalLabelTPL := label.new(bar_index, longTake1Price, takeprofitOnLong, style=label.style_none, size=size.normal, textcolor=color.green)
    FinalLabelpriceL := label.new(bar_index, strategy.position_avg_price, precoentrada, style=label.style_none, size=size.normal, textcolor=color.blue)
    
    // Delete previous label when there is a consecutive new high, as there's no line plot in that case.
    if strategy.position_size > 0[1]
        label.delete(slFinalLabelL[1])
        label.delete(slFinalLabelTPL[1])
        label.delete(FinalLabelpriceL[1])

if strategy.position_size < 0   
    
    //write the price above the end of the stoploss line
    slFinalLabelS := label.new(bar_index, shortStop, stopLossOnShort, style=label.style_none, size=size.normal, textcolor=color.red)
    slFinalLabelTPS := label.new(bar_index, shortTake1Price, takeprofitOnShort, style=label.style_none, size=size.normal, textcolor=color.green)
    FinalLabelpriceS := label.new(bar_index, strategy.position_avg_price, precoentrada, style=label.style_none, size=size.normal, textcolor=color.blue)
    
    // Delete previous label when there is a consecutive new high, as there's no line plot in that case.
    if strategy.position_size < 0[1]
        label.delete(slFinalLabelS[1])
        label.delete(slFinalLabelTPS[1]) 
        label.delete(FinalLabelpriceS[1])

    
// Exit open market position when date range ends
if (not _inDateRange)
    strategy.close_all()