黄金比平均回帰トレンド取引戦略

概要
黄金分割式平均値回帰トレンド取引戦略は,通道指標と移動平均を使用して,より強いトレンドの方向を識別し,価格が一定割合の反転が発生した後,トレンドの方向にポジションを開くことができます. この戦略は,より強いトレンドの特徴を持つ市場に適しており,トレンドの状況でより良いパフォーマンスを得ることができます.
戦略原則
この戦略の核心指標には,通路指標,移動平均,リコールトリガーラインが含まれている.具体的には:
- 通路指標は,価格通路を識別するために,最高価格と最低価格の計算から成ります.
- 移動平均は価格の全体的な傾向方向を判断するために使用されます.
- リコールトリガーラインは,通路の境界から価格が一定割合で反発した後にポジションを開くために使用される.
価格がチャネルの底に触れたとき,戦略は最低点を参照点として記録し,空白を許容する標識を設定する.価格が上昇したときに,上昇幅が回調比に達すると,反発点の近くで空白を打開する.
逆に,価格がチャネルの頂点に触れたとき,戦略は最高点を参照点として記録し,多行符号を許容するように設定する.価格が下がったとき,下落幅が回調比率要求に達した場合,その点の近くで多行を開く.
したがって,この戦略の取引論理は,価格チャネルを追跡し,反転シグナルが発生したときに適切なポイントを選択して既存のトレンドに介入することです.これはトレンドリバーシング型の取引戦略の一般的な套路です.
優位分析
この戦略の利点は以下の通りです.
- 強いトレンドの状況下では,よりよいパフォーマンスを得ることができます.
- 戦略の入場厳しさは,回帰比率のパラメータによって調整できます.
- 合理的な撤回制御により,単一損失を制限できます.
具体的には,戦略は主にトレンドの逆転点でポジションを開くため,価格の変動が大きく,トレンドが顕著な市場ではより効果的である.さらに,回帰比率のパラメータを調整することで,戦略のトレンド追跡の激進度を制御することができる.最後に,ストップ・ロスの方法によって単一損失を制御することができる.
リスク分析
この戦略には以下の主要なリスクがあります.
- 戦略は,取引品種のトレンド特性に敏感である.
- 調整比率の誤った設定は 過激的または保守的な結果をもたらす可能性があります.
- 長期にわたって保有するリスクがあるため,夜更かしのリスクに注意する必要があります.
具体的には,戦略が適用される取引品種の傾向が弱く,波動が小さい場合,効果は割引される可能性があります.また,回収比率が大きすぎたり小さすぎたりすると,戦略のパフォーマンスに影響します.最後に,戦略のポジションの時間帯が長い可能性があるため,また,夜間リスクの管理にも注意する必要があります.
上記のリスクを回避するために,以下の側面を最適化することを検討できます.
- 取引の種類は,トレンドの特徴がより顕著であるものを選択します.
- パラメーターを調整し,最適のパラメータの組み合わせを探します.
- Exit ストップを設定し,ポジション保持時間を合理的に制御する.
要約する
黄金分割式平均値回帰トレンド取引戦略は,単純な指標によって価格トレンドと回調シグナルを判断し,強気な状況でポジション追跡トレンドを開く,より典型的なトレンドシステムに属している.この戦略のパラメータ調整の余地が大きいので,最適化によりより多くの市場環境に適応することができ,リスク管理もより合理的である.したがって,それは実用的にテストし,改良する価値のある最適化戦略のアイデアである.
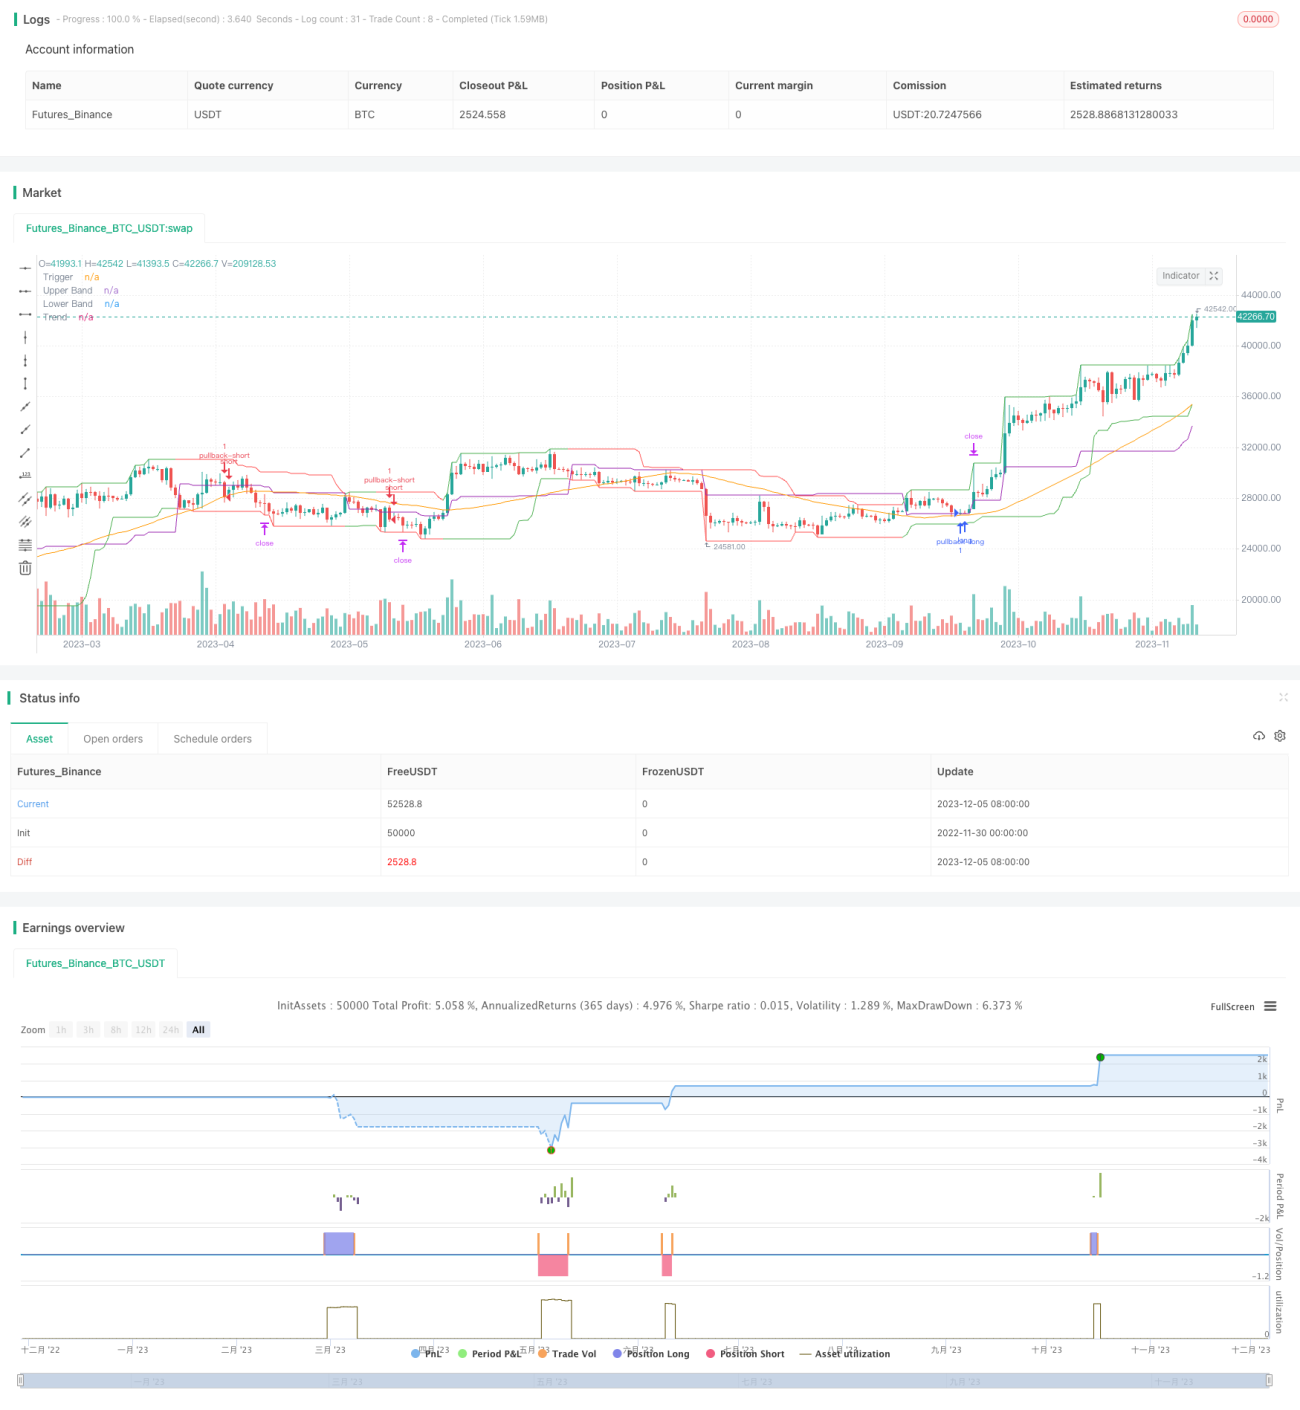
/*backtest
start: 2022-11-30 00:00:00
end: 2023-12-06 00:00:00
period: 1d
basePeriod: 1h
exchanges: [{"eid":"Futures_Binance","currency":"BTC_USDT"}]
*/

//@version=3
//
// A port of the TradeStation EasyLanguage code for a mean-revision strategy described at
// http://traders.com/Documentation/FEEDbk_docs/2017/01/TradersTips.html- 1