더블 EMA 이동 평균 교차 전략

개요
이중 EMA 평균선 교차 전략은 일반적인 트렌드 추적 전략이다. 이 전략은 두 개의 다른 주기의 EMA 평균선을 사용하여, 짧은 주기 EMA 상에서 긴 주기 EMA를 통과할 때 구매 신호를 생성하고, 짧은 주기 EMA 아래에서 긴 주기 EMA를 통과할 때 판매 신호를 생성하여 가격 트렌드의 변화를 포착한다.
전략 원칙
이 전략의 핵심 논리는 EMA 평균선의 금강포크시드포크 원칙에 기초한다. EMA 평균선은 가격 데이터를 효과적으로 평형화하여 트렌드 방향을 알려준다. 단기 EMA선은 가격 변화에 더 빠르게 반응하지만, 장기 EMA선은 노이즈에 상대적으로 민감하지 않으며, 장기 트렌드를 반영한다. 단기 EMA 상에서 긴 주기 EMA를 통과하면 가격 상승 동력이 증가하는 신호로 간주되며, 단기 EMA 상에서 긴 주기 EMA를 통과하면 가격 하락 동력이 심화되는 신호로 간주된다.
구체적으로, 이 전략은 length1과 length2의 변수를 사용하여 두 EMA 평균선의 길이를 설정한다. demaVal1은 length1의 EMA 평균선이고, demaVal2는 length2의 EMA 평균선이다. 둘은 다음과 같이 계산된다:
mylang
demaVal1 = EMA(close, length1)
demaVal2 = EMA(close, length2)
여기서 EMA() 는 EMA의 평균선을 계산하는 함수이다. demaVal1 위를 통과할 때 demaVal2를 통과할 때 구매 신호 demaCrossover를 생성하고, 아래를 통과할 때 판매 신호 demaCrossunder을 생성한다. 전략은 이 두 신호에 따라 거래 지시를 낸다.
전략적 이점
이 전략은 다음과 같은 장점을 가지고 있습니다.
- 전략적 논리는 간단하고 이해하기 쉽고 실행하기 쉽습니다.
- 평선 교차 이론은 성숙하고, 응용 분야는 광범위하다.
- 구성 가능한 변수 길이는 다양한 시장 환경에 적합합니다.
- 최적화 매개 변수를 사용하여 전략 효과를 높일 수 있습니다.
위험과 최적화
이 전략에는 몇 가지 위험도 있습니다.
- 시장이 트렌드하지 않을 때, EMA 교차 신호는 빈번한 가짜 신호가 발생할 수 있다.
- 기본 파라미터는 모든 품종에 적용되지 않을 수 있으며, 역사 데이터에 따라 타겟팅 최적화가 필요합니다.
위와 같은 위험에 따라 다음과 같은 측면에서 최적화할 수 있습니다.
- EMA 주기 변수를 조정하여 다른 주기 상황에 맞게 조정한다.
- 필터링 조건을 추가하여 잘못된 신호를 방지하십시오. 예를 들어, 우수성 지표, 거래량 지표와 같은 적합성 지표
- 트렌드, 지지, 저항점 등의 기술 지표와 결합하여 전략의 효과를 높여라.
요약하다
이중 EMA 평선 교차 전략은 전체적으로 간단한 실용적인 트렌드 추적 전략이다. 평선 교차 분석의 정교한 이론을 계승하고, 매개 변수 조정과 필터 조건의 최적화를 전제로, 다양한 품종의 트렌드 거래에 적용할 수 있으며, 좋은 응용 전망을 가지고 있다.
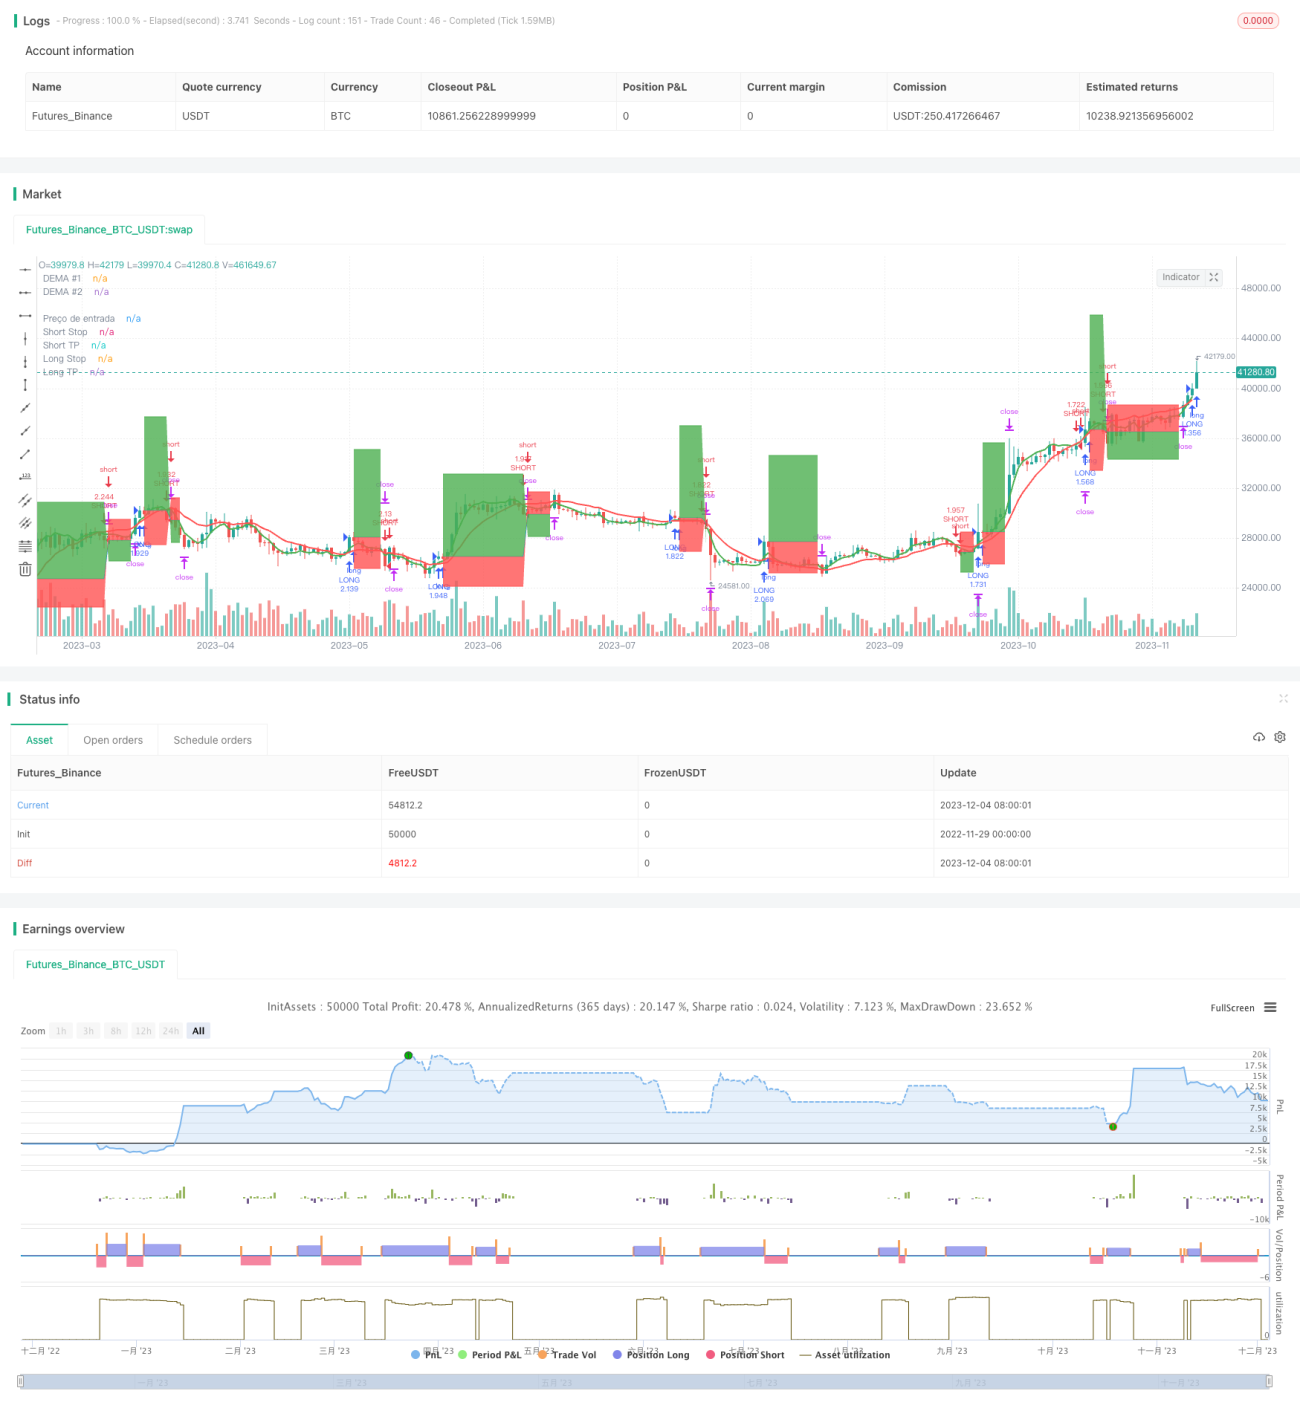
/*backtest
start: 2022-11-29 00:00:00
end: 2023-12-05 00:00:00
period: 1d
basePeriod: 1h
exchanges: [{"eid":"Futures_Binance","currency":"BTC_USDT"}]
*/

// This source code is subject to the terms of the Mozilla Public License 2.0 at https://mozilla.org/MPL/2.0/
// © zeguela
//@version=4
strategy(title="ZEGUELA DEMABOT", commission_value=0.063, commission_type=strategy.commission.percent, initial_capital=100, default_qty_value=90, default_qty_type=strategy.percent_of_equity, overlay=true, process_orders_on_close=true)- 1