
이중 지표 구매 필터 구매 신호 전략은 무작위 지수 평평한 이동 평균 ((Stochastic RSI) 과 브린 밴드 지표의 조합을 사용하여 잠재적인 구매 기회를 식별합니다. 이 전략은 가장 유리한 구매 지점을 구별하기 위해 여러 필터 조건을 사용합니다. 이것은 시장의 변동 환경에서 높은 확률의 구매 시기를 식별 할 수 있습니다.
이 전략은 구매 기회를 식별하기 위해 두 가지의 지표를 사용합니다.
첫째, 그것은 무작위 지수 평행 이동 평균을 사용하여 시장이 과매매되었는지 여부를 판단한다. 이 지표는 무작위 지수와 그것의 평행 이동 평균을 결합하여, %K 라인이 낮은 지점에서 %D 라인을 통과하면, 과매매 신호로 간주된다. 여기에 기한이 설정되어 있으며, %K 라인이 20 이상일 때 과매매로 간주된다.
둘째, 이 전략은 부린 반지 지표를 사용하여 가격 변화를 식별한다. 부린 반지는 가격의 표준 격차에 따라 계산된다. 가격이 하향 궤도에 가까워지면 과매매 상태에 속한다. 이 전략은 여기서 2배 표준 격차의 파라미터를 설정하여 부린 반지 범위를 더 넓히고 더 많은 가짜 신호를 필터링한다.
이 전략은 상술한 두 가지 지표의 초과 판매 신호를 받은 후, 구매 시기를 추가적으로 식별하기 위해 여러 필터링 조건을 추가합니다.
종합 판단 후 식별된 구매 시기는 구매 신호를 발송한다.
이 두 가지 지표가 필터링되는 전략에는 다음과 같은 장점이 있습니다.
전체적으로, 이 전략은 여러 가지 기술 지표와 필터링 방법을 통합하여 구매 시기를 더 정확하고 신뢰할 수 있게 만들고, 결과적으로 더 나은 거래 성과를 얻습니다.
이 두가지 지수 필터링 전략은 많은 장점들을 가지고 있지만, 몇 가지 위험도 있습니다.
위와 같은 위험들에 대해, 이 전략은 다음과 같이 최적화될 수 있습니다.
이 두 개의 지표 필터링 전략은 다음의 몇 가지 차원에서 더욱 최적화 될 수 있습니다.
더 많은 첨단 기술과 방법을 도입하여 이중 지수 필터링 전략은 더 정확한 구매 시점 선택과 더 강력한 위험 제어 능력을 얻을 수 있습니다. 따라서 실전에서 더 안정적이고 신뢰할 수있는 수익을 얻을 수 있습니다.
요약하자면, 이중 지표 구매 필터 구매 신호 전략은 Stochastic RSI와 브린 벨트와 같은 여러 가지 기술 지표를 사용하며, 가격 강도 및 회귀 판단과 같은 여러 가지 필터링 조건을 결합하여, 높은 확률의 신뢰할 수있는 구매 시기를 식별합니다. 파라미터 최적화, 스톱 손실 설정 등이 더 개선되면, 이 전략은 수익 안정의 정량 거래 전략 중 하나가 될 수 있습니다.
그것의 핵심 장점은 지표와 필터 조건의 효과적인 결합에 있다, 구매 시점을 판단하는 것을 더 정확하게한다. 위험과 최적화 방향도 제어할 수 있다. 전체적으로, 이것은 실제 실행할 수 있는 높은 효율의 계량화 전략이다.
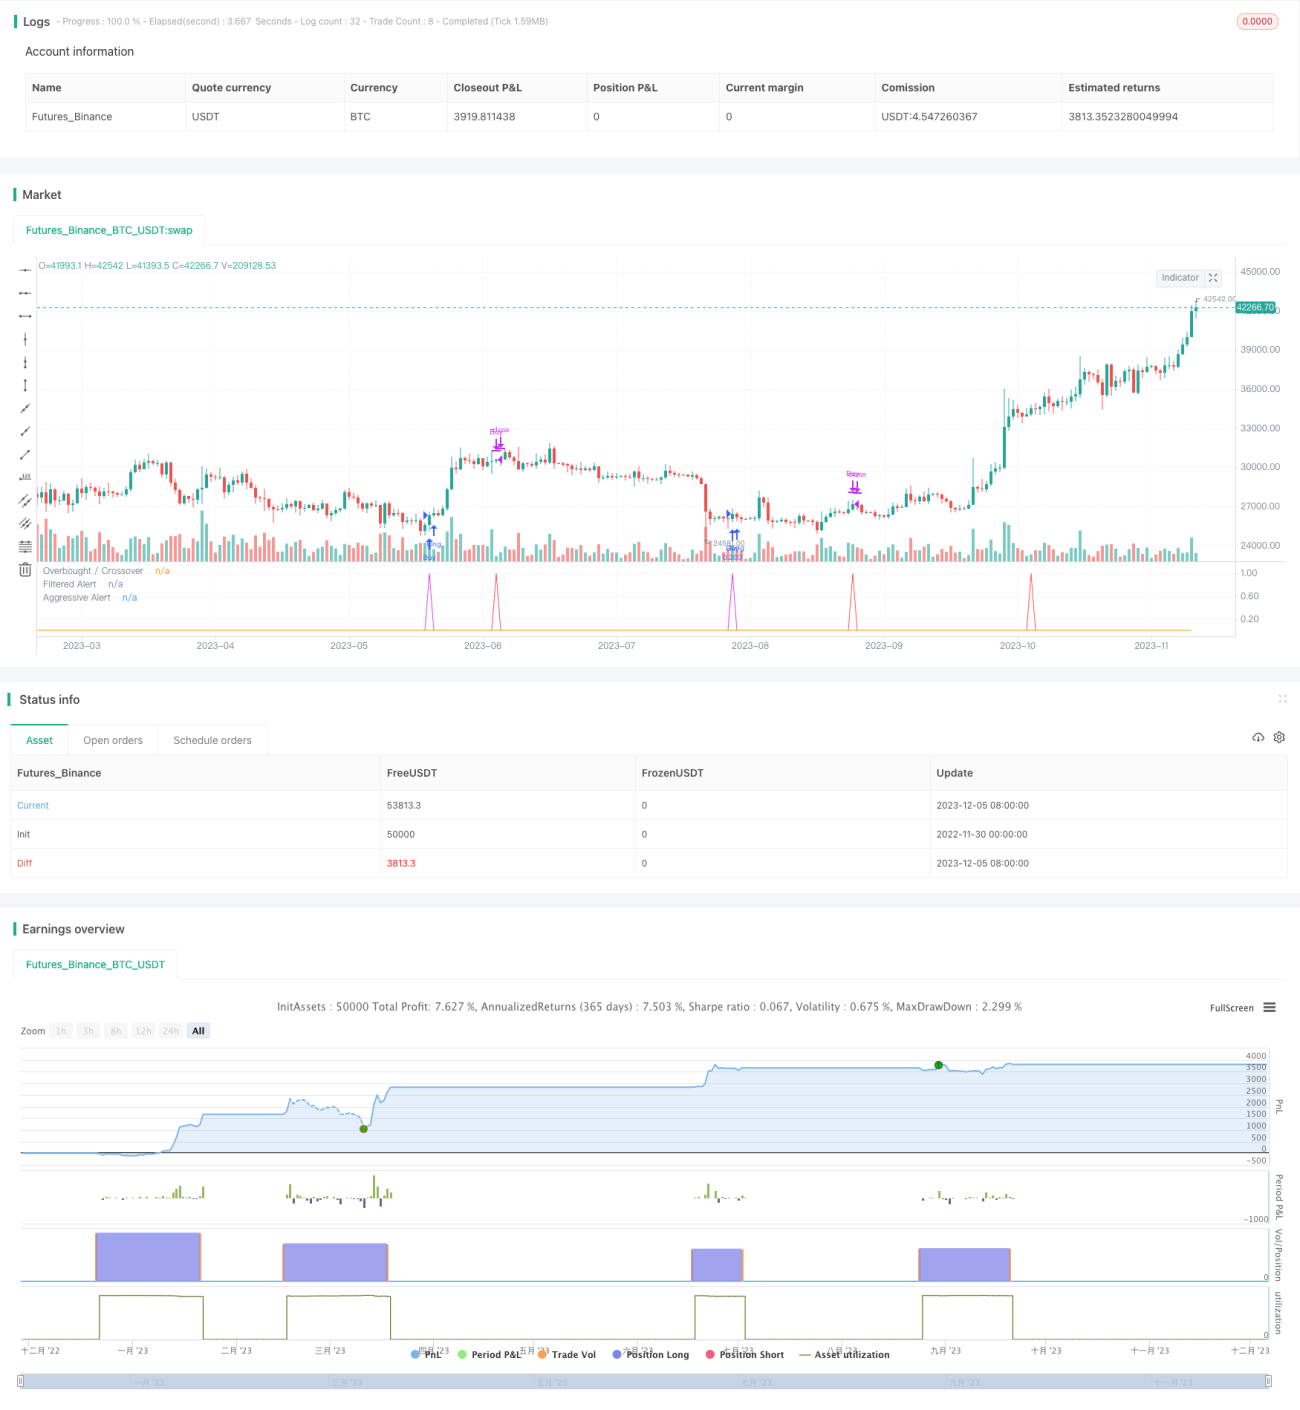
/*backtest
start: 2022-11-30 00:00:00
end: 2023-12-06 00:00:00
period: 1d
basePeriod: 1h
exchanges: [{"eid":"Futures_Binance","currency":"BTC_USDT"}]
*/
//@version=4
strategy("SORAN Buy and Close Buy", pyramiding=1, initial_capital=10000, default_qty_type=strategy.percent_of_equity, default_qty_value=10, overlay=false)
////Buy and Close-Buy messages
Long_message = input("")
Close_message = input("")
///////////// Stochastic Slow
Stochlength = input(14, minval=1, title="lookback length of Stochastic")
StochOverBought = input(80, title="Stochastic overbought condition")
StochOverSold = input(20, title="Stochastic oversold condition")
smoothK = input(3, title="smoothing of Stochastic %K ")
smoothD = input(3, title="moving average of Stochastic %K")
k = sma(stoch(close, high, low, Stochlength), smoothK)
d = sma(k, smoothD)
///////////// RSI
RSIlength = input( 14, minval=1 , title="lookback length of RSI")
RSIOverBought = input( 70 , title="RSI overbought condition")
RSIOverSold = input( 30 , title="RSI oversold condition")
RSIprice = close
vrsi = rsi(RSIprice, RSIlength)
///////////// Double strategy: RSI strategy + Stochastic strategy
pd = input(22, title="LookBack Period Standard Deviation High")
bbl = input(20, title="Bolinger Band Length")
mult = input(2.0 , minval=1, maxval=5, title="Bollinger Band Standard Devaition Up")
lb = input(50 , title="Look Back Period Percentile High")
ph = input(.85, title="Highest Percentile - 0.90=90%, 0.95=95%, 0.99=99%")
new = input(false, title="-------Text Plots Below Use Original Criteria-------" )
sbc = input(false, title="Show Text Plot if WVF WAS True and IS Now False")
sbcc = input(false, title="Show Text Plot if WVF IS True")
new2 = input(false, title="-------Text Plots Below Use FILTERED Criteria-------" )
sbcFilt = input(true, title="Show Text Plot For Filtered Entry")
sbcAggr = input(true, title="Show Text Plot For AGGRESSIVE Filtered Entry")
ltLB = input(40, minval=20, maxval=99, title="Long-Term Look Back Current Bar Has To Close Below This Value OR Medium Term--Default=40")
mtLB = input(14, minval=1, maxval=40, title="Medium-Term Look Back Current Bar Has To Close Below This Value OR Long Term--Default=14")
str = input(3, minval=1, maxval=9, title="Entry Price Action Strength--Close > X Bars Back---Default=3")
//Alerts Instructions and Options Below...Inputs Tab
new4 = input(false, title="-------------------------Turn On/Off ALERTS Below---------------------" )
new5 = input(false, title="----To Activate Alerts You HAVE To Check The Boxes Below For Any Alert Criteria You Want----")
sa1 = input(false, title="Show Alert WVF = True?")
sa2 = input(false, title="Show Alert WVF Was True Now False?")
sa3 = input(false, title="Show Alert WVF Filtered?")
sa4 = input(false, title="Show Alert WVF AGGRESSIVE Filter?")
//Williams Vix Fix Formula
wvf = ((highest(close, pd)-low)/(highest(close, pd)))*100
sDev = mult * stdev(wvf, bbl)
midLine = sma(wvf, bbl)
lowerBand = midLine - sDev
upperBand = midLine + sDev
rangeHigh = (highest(wvf, lb)) * ph
//Filtered Bar Criteria
upRange = low > low[1] and close > high[1]
upRange_Aggr = close > close[1] and close > open[1]
//Filtered Criteria
filtered = ((wvf[1] >= upperBand[1] or wvf[1] >= rangeHigh[1]) and (wvf < upperBand and wvf < rangeHigh))
filtered_Aggr = (wvf[1] >= upperBand[1] or wvf[1] >= rangeHigh[1]) and not (wvf < upperBand and wvf < rangeHigh)
//Alerts Criteria
alert1 = wvf >= upperBand or wvf >= rangeHigh ? 1 : 0
alert2 = (wvf[1] >= upperBand[1] or wvf[1] >= rangeHigh[1]) and (wvf < upperBand and wvf < rangeHigh) ? 1 : 0
alert3 = upRange and close > close[str] and (close < close[ltLB] or close < close[mtLB]) and filtered ? 1 : 0
alert4 = upRange_Aggr and close > close[str] and (close < close[ltLB] or close < close[mtLB]) and filtered_Aggr ? 1 : 0
//Coloring Criteria of Williams Vix Fix
col = wvf >= upperBand or wvf >= rangeHigh ? #00E676 : #787B86
isOverBought = (crossover(k,d) and k > StochOverBought) ? 1 : 0
isOverBoughtv2 = k > StochOverBought ? 1 : 0
filteredAlert = alert3 ? 1 : 0
aggressiveAlert = alert4 ? 1 : 0
plot(isOverBought, "Overbought / Crossover", style=plot.style_line, color=#FF5252)
plot(filteredAlert, "Filtered Alert", style=plot.style_line, color=#E040FB)
plot(aggressiveAlert, "Aggressive Alert", style=plot.style_line, color=#FF9800)
if (filteredAlert or aggressiveAlert)
strategy.entry("Buy", strategy.long, alert_message = Long_message)
if (filteredAlert or aggressiveAlert)
alert("Buy Signal", alert.freq_once_per_bar)
if (isOverBought)
strategy.close("Buy", alert_message = Close_message)