골든 섹션 평균 회귀 추세 거래 전략

개요
골드분기형 평균값 회귀 트렌드 거래 전략은 통로 지표와 이동 평균을 사용하여 강력한 트렌드 방향을 식별하여 가격의 일정 비율의 회귀가 발생한 후 트렌드 방향에서 포지션을 열 수 있습니다. 이 전략은 강한 트렌드 특성을 가진 시장에 적합하며 트렌드 상황에서 더 나은 성능을 얻을 수 있습니다.
전략 원칙
이 전략의 핵심 지표는 통로 지표, 이동 평균 및 회귀 트리거 라인이다. 구체적으로:
- 통로 지표는 최고 가격과 최저 가격을 계산하여 가격 통로를 식별합니다.
- 이동 평균은 가격의 전반적인 추세 방향을 판단하는데 사용된다.
- 리콜 트리거 라인은 가격의 통로 경계에서 반발한 후 일정 비율로 포지션을 열기 위해 사용됩니다.
가격이 통로의 바닥을 만질 때, 전략은 최저 지점을 참조점으로 기록하고,空白를 허용하는 표시를 설정한다. 가격이 상승할 때, 상승幅度가 회귀 비율을 달성 한 후, 부진 지점 근처에空置을 열 것이다.
반대로, 가격이 통로의 꼭대기를 만지면, 전략은 최고점을 기준점으로 기록하고, 더 많은 표시를 허용하도록 설정한다. 가격이 떨어지면, 하락의 폭이 회귀 비율 요구 사항을 충족하면, 그 지점 근처에 더 많은 포지션을 열 수 있다.
따라서, 이 전략의 거래 논리는 가격 채널을 추적하고, 반전 신호가 발생했을 때 적절한 지점을 선택하여 현존하는 추세에 개입하는 것이다. 이것은 추세 회귀 유형의 거래 전략의 일반적인 방식이다.
우위 분석
이 전략은 다음과 같은 장점을 가지고 있습니다.
- 강세를 보인 시점에 더 좋은 성과를 낼 수 있습니다.
- 역조율 변수를 통해 전략의 진입 강도를 조정할 수 있습니다.
- 합리적인 철수 통제는 단독 손실을 제한합니다.
구체적으로, 전략은 주로 트렌드 반전 시점에 포지션을 열기 때문에 가격 변동이 크고 트렌드가 뚜렷한 시장에서 더 효과적이다. 또한, 회귀 비율 파라미터를 조정하면 전략이 트렌드를 추적하는 정도를 조절할 수 있다. 마지막으로, 손실을 막는 방법으로 단위 손실을 제어할 수 있다.
위험 분석
이 전략에는 다음과 같은 주요 위험도 있습니다.
- 전략은 거래 품종의 트렌드 특성에 민감합니다.
- 회귀 비율의 잘못된 설정은 지나치게 급진적이거나 보수적일 수 있습니다.
- 이 지분 보유 기간이 너무 길어서 야간 위험도 주의해야 합니다.
구체적으로, 전략이 적용되는 거래 품종이 경향성이 약하고 변동성이 작다면, 효과는 할인될 수 있다. 또한, 회귀 비율이 너무 크거나 너무 작으면 전략의 성과에 영향을 미칠 수 있다. 마지막으로, 전략의 포지션 기간이 길어질 수 있기 때문에, 또한 야간 위험을 통제하는 것에 주의해야 한다.
위와 같은 위험을 피하기 위해, 다음의 몇 가지 측면을 최적화하는 것을 고려할 수 있습니다.
- 트렌드 특징이 더 잘 드러나는 거래 품종을 선택하세요.
- 조정 회귀 비율 파라미터 최적의 파라미터 조합을 찾습니다.
- Exit를 설정하여 상장 시간을 합리적으로 제어한다.
요약하다
금분식형 평균값 회귀 트렌드 거래 전략은 간단한 지표를 통해 가격 트렌드와 회귀 신호를 판단하고, 강세를 보이는 상황에서 포지션 추적 트렌드를 열며, 비교적 전형적인 트렌드 시스템에 속한다. 이 전략의 파라미터 조정 최적화 공간은 넓고, 더 많은 시장 환경에 적응할 수 있도록 최적화 할 수 있으며, 위험 제어도 합리적이다. 따라서, 실제 테스트 및 개선할 가치가 있는 최적화 전략이다.
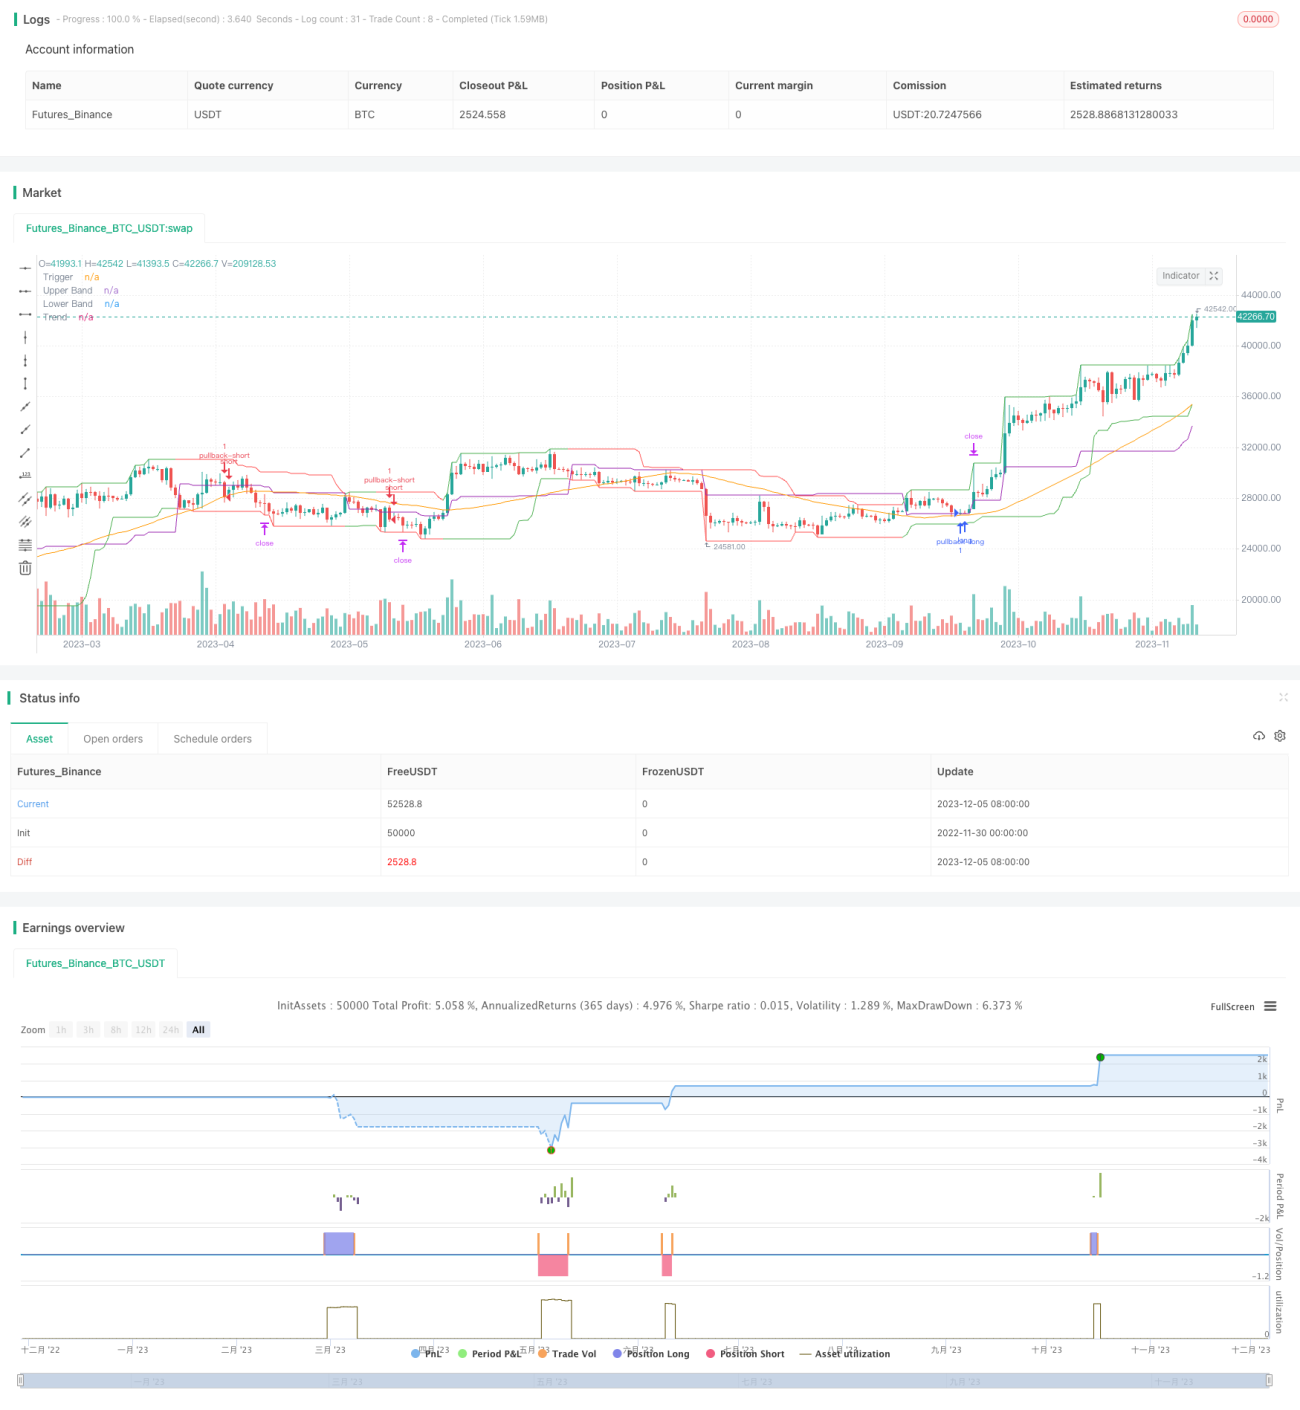
/*backtest
start: 2022-11-30 00:00:00
end: 2023-12-06 00:00:00
period: 1d
basePeriod: 1h
exchanges: [{"eid":"Futures_Binance","currency":"BTC_USDT"}]
*/

//@version=3
//
// A port of the TradeStation EasyLanguage code for a mean-revision strategy described at
// http://traders.com/Documentation/FEEDbk_docs/2017/01/TradersTips.html- 1