Estratégia de Crossover de Média Móvel Double EMA


Data de criação: 2023-12-06 18:22:16 última modificação: 2023-12-06 18:22:16
cópia: 0 Cliques: 680
1
focar em
1619
Seguidores

Estratégia de Crossover de Média Móvel Double EMA

Visão geral

A estratégia de cruzamento de dupla linha média do EMA é uma estratégia de acompanhamento de tendências comum. A estratégia usa a linha média do EMA de dois períodos diferentes, gerando um sinal de compra quando o EMA de curto período atravessa o EMA de longo período e um sinal de venda quando o EMA de curto período atravessa o EMA de longo período para capturar mudanças na tendência de preços.

Princípio da estratégia

A lógica central da estratégia baseia-se no princípio do “fork-dead-fork” da linha média do EMA. A linha média do EMA pode suavizar os dados de preços de forma eficaz, indicando a direção da tendência. A linha do EMA de curto período responde mais rapidamente às mudanças de preço, enquanto a linha do EMA de longo período é relativamente insensível ao ruído e reflete a tendência de longo prazo.

Em particular, a estratégia usa os parâmetros length1 e length2 para definir o comprimento de duas linhas médias do EMA. DemaVal1 é a linha média do EMA de comprimento 1 e DemaVal2 é a linha média do EMA de comprimento 2.

demaVal1 = EMA(close, length1)  
demaVal2 = EMA(close, length2)

Onde EMA() é a função de cálculo da linha média EMA. Quando demaVal1 atravessa demaVal2 gera o sinal de compra demaCrossover, quando atravessa demaCrossunder gera o sinal de venda demaCrossunder. A estratégia emite instruções de negociação de acordo com esses dois sinais.

Vantagens estratégicas

A estratégia tem as seguintes vantagens:

  1. A lógica da estratégia é simples, fácil de entender e de implementar.
  2. A teoria do cruzamento equilíneo está madura e é amplamente utilizada.
  3. O comprimento dos parâmetros configuráveis é flexível para diferentes ambientes de mercado.
  4. Pode melhorar a eficácia da estratégia através de parâmetros de otimização.

Risco e otimização

A estratégia também apresenta alguns riscos:

  1. Quando o mercado não está em tendência, o sinal de cruzamento do EMA pode ser frequentemente falso.
  2. Os parâmetros padrão podem não ser aplicados a todas as variedades e precisam ser otimizados com base em dados históricos.

De acordo com os riscos acima, pode-se fazer otimização em vários aspectos:

  1. Ajustar os parâmetros do ciclo EMA para diferentes situações de ciclo.
  2. Aumentar as condições de filtragem para evitar falsos sinais, como indicadores de correspondência de excelência, indicadores de volume de transação, etc.
  3. Combinando tendências com indicadores técnicos, como resistência de suporte, para melhorar a eficácia da estratégia.

Resumir

A estratégia de duplo cruzamento equilíneo da EMA é uma estratégia de acompanhamento de tendências simples e práticas. Ela herda a teoria avançada da análise de cruzamento equilíneo e pode ser aplicada a negociação de tendências de diferentes variedades, com boas perspectivas de aplicação, sob a premissa de ajuste de parâmetros e otimização de condições de filtragem.
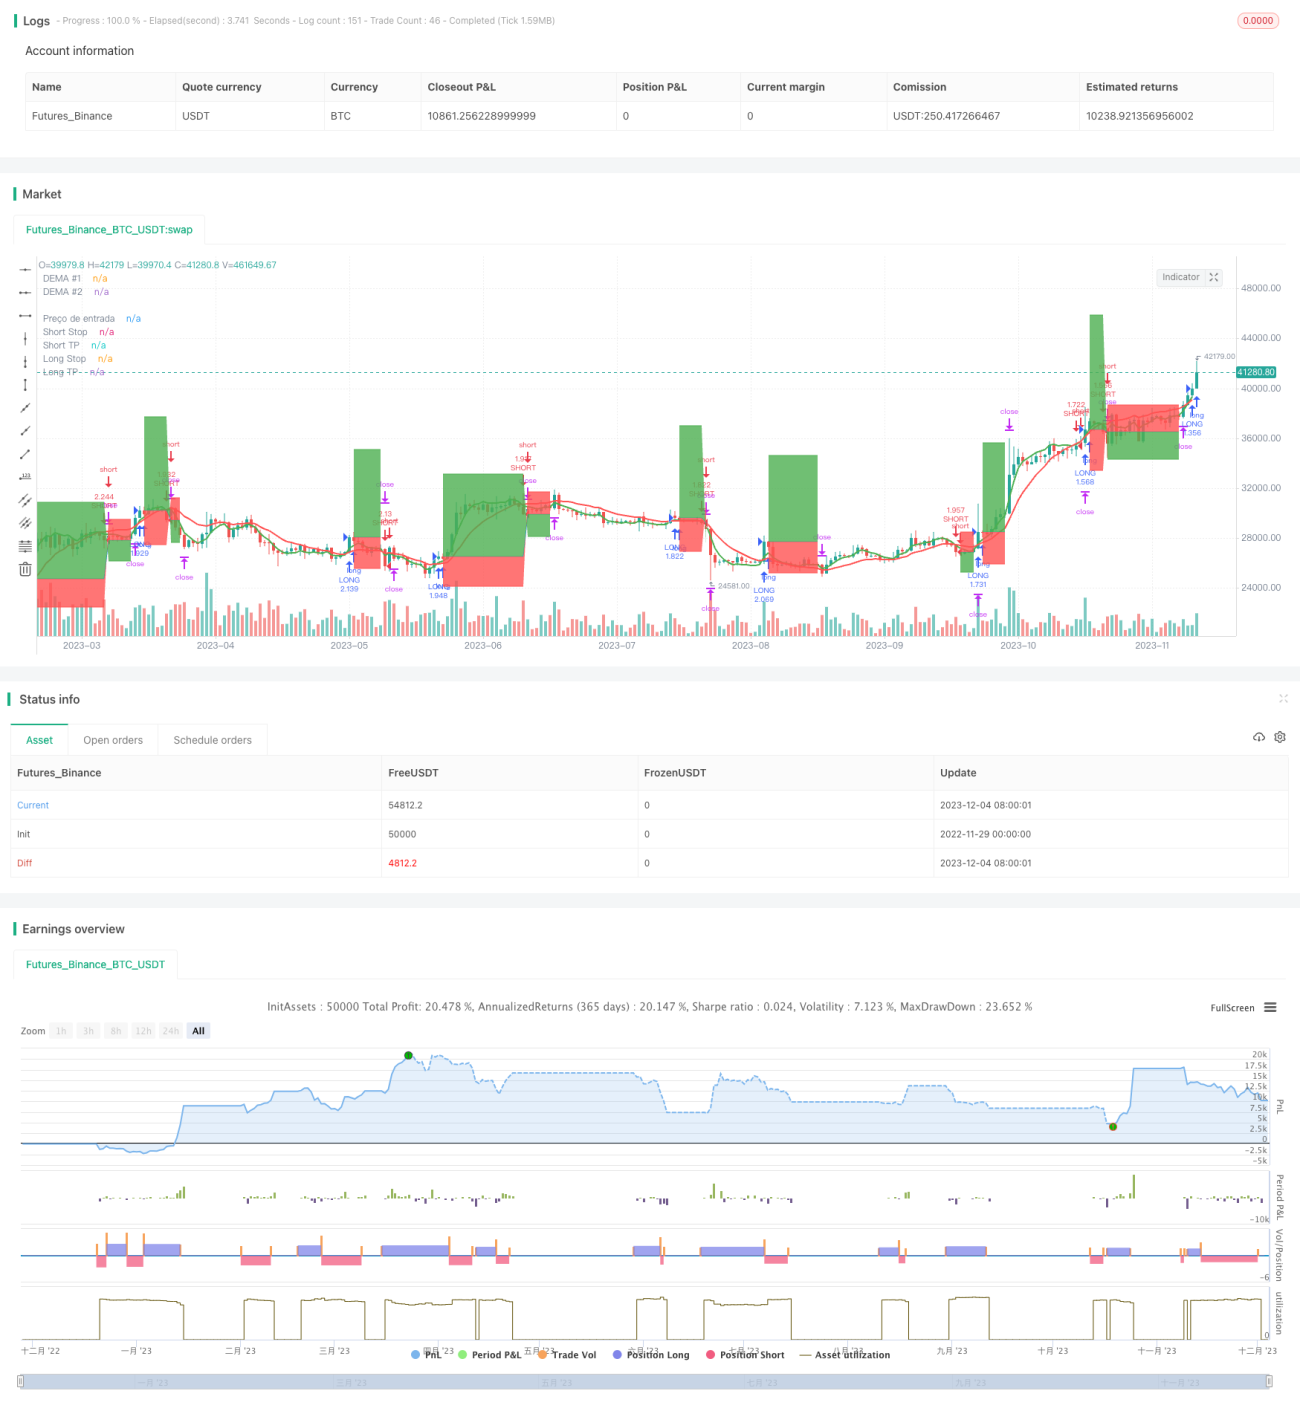
Código-fonte da estratégia
/*backtest
start: 2022-11-29 00:00:00
end: 2023-12-05 00:00:00
period: 1d
basePeriod: 1h
exchanges: [{"eid":"Futures_Binance","currency":"BTC_USDT"}]
*/

// This source code is subject to the terms of the Mozilla Public License 2.0 at https://mozilla.org/MPL/2.0/
// © zeguela
//@version=4
strategy(title="ZEGUELA DEMABOT", commission_value=0.063, commission_type=strategy.commission.percent, initial_capital=100, default_qty_value=90, default_qty_type=strategy.percent_of_equity, overlay=true, process_orders_on_close=true)

// Step 1. Script settings

// Input options
srcData = input(title="Source Data", type=input.source, defval=close)

// Length settings
len1 = input(title="Length DEMA #1", type=input.integer, defval=8, minval=1)
len2 = input(title="Length DEMA #2", type=input.integer, defval=24, minval=0)
len3 = input(title="Length DEMA #3", type=input.integer, defval=0, minval=0)

// Step 2. Calculate indicator values
// Function that calculates the DEMA
DEMA(series, length) =>
    if (length > 0)
        emaValue = ema(series, length)
        2 * emaValue - ema(emaValue, length)
    else
        na

// Calculate the DEMA values
demaVal1 = DEMA(srcData, len1)
demaVal2 = DEMA(srcData, len2)
demaVal3 = DEMA(srcData, len3)

// Step 3. Determine indicator signals
// See if there's a DEMA crossover
demaCrossover = if (len2 > 0) and (len3 > 0)
    crossover(demaVal1, demaVal2) and (demaVal3 > demaVal3[1])
else
    if (len2 > 0) and (len3 == 0)
        crossover(demaVal1, demaVal2)
    else
        if (len3 > 0) and (len2 == 0)
            crossover(demaVal1, demaVal3)
        else
            crossover(close, demaVal1)

// Check if there's a DEMA crossunder
demaCrossunder = if (len2 > 0) and (len3 > 0)
    crossunder(demaVal1, demaVal2) and (demaVal3 < demaVal3[1])
else
    if (len2 > 0) and (len3 == 0)
        crossunder(demaVal1, demaVal2)
    else
        if (len3 > 0) and (len2 == 0)
            crossunder(demaVal1, demaVal3)
        else
            crossunder(close, demaVal1)

// Step 4. Output indicator data
// Plot DEMAs on the chart
plot(series=demaVal1, color=color.green, linewidth=2, title="DEMA #1")
plot(series=demaVal2, color=color.red, linewidth=2, title="DEMA #2")
plot(series=demaVal3, color=color.fuchsia, linewidth=2, title="DEMA #3")

//TRAILING STOP CODE
a = input(title="Usar Trailing Stop?", type=input.bool, defval=false)

stopPerlong = input(9.0, title='Stop Loss Long %', type=input.float, group="Stop Loss & Take Profit Settings") / 100
stopPershort = input(6.0, title='Stop Loss Short %', type=input.float, group="Stop Loss & Take Profit Settings") / 100
take1Perlong = input(25.0, title='Take Profit Long % 1', type=input.float, group="Stop Loss & Take Profit Settings") / 100
take1Pershort = input(6.0, title='Take Profit Short % 1', type=input.float, group="Stop Loss & Take Profit Settings") / 100

// Determine stop loss price
longStopPrice  = strategy.position_avg_price * (1 - stopPerlong)
shortStopPrice = strategy.position_avg_price * (1 + stopPershort)
longTake1Price = strategy.position_avg_price * (1 + take1Perlong)
shortTake1Price = strategy.position_avg_price * (1 - take1Pershort)

// Determine trail stop loss prices

longStopPriceTrail = 0.0

longStopPriceTrail := if (strategy.position_size > 0)
    stopValue = close * (1 - stopPerlong)
    max(stopValue, longStopPriceTrail[1])
else
    0

// Determine trailing short price
shortStopPriceTrail = 0.0

shortStopPriceTrail := if (strategy.position_size < 0)
    stopValue = close * (1 + stopPershort)
    min(stopValue, shortStopPriceTrail[1])
else
    999999

//calcular qual stop usar
longStop = a ? longStopPriceTrail : longStopPrice
shortStop = a ? shortStopPriceTrail : shortStopPrice


//calcula o valor do stop e TP pra lançar no alerta
longStopEntrada = close  * (1 - stopPerlong)
shortStopEntrada = close  * (1 + stopPershort) 
longTPEntrada = close * (1 + take1Perlong)
shortTPEntrada = close * (1 - take1Pershort)

//armazena o preço de entrada e valor do SL e TP

price_entryL = 0.0
price_entryL := na(price_entryL) ? na : price_entryL[1]
price_entryS = 0.0
price_entryS := na(price_entryS) ? na : price_entryS[1]
stopL = 0.0
stopL := na(stopL) ? na : stopL[1]
stopS = 0.0
stopS := na(stopS) ? na : stopS[1]
takeL = 0.0
takeL := na(takeL) ? na : takeL[1]
takeS = 0.0
takeS := na(takeS) ? na : takeS[1]

if (demaCrossover)
    price_entryL := close
    stopL := close  * (1 - stopPerlong)
    takeL := close * (1 + take1Perlong)
    
if (demaCrossunder)
    price_entryS := close
    stopS := close  * (1 + stopPershort)
    takeS := close * (1 - take1Pershort)

resultadoL = ((close - price_entryL)/price_entryL) * 100
resultadoLexit = "(SL = 1% e TP = 0,5%)"
resultadoS = ((price_entryS - close)/price_entryS) * 100
resultadoSexit = "(SL = 1% e TP = 0,5)%"
// Make input options that configure backtest date range
_startDate = input(title="Start Date", type=input.integer,
     defval=1, minval=1, maxval=31, group="BackTest Period")
_startMonth = input(title="Start Month", type=input.integer,
     defval=1, minval=1, maxval=12, group="BackTest Period")
_startYear = input(title="Start Year", type=input.integer,
     defval=2018, minval=1800, maxval=2100, group="BackTest Period")

_endDate = input(title="End Date", type=input.integer,
     defval=31, minval=1, maxval=31, group="BackTest Period")
_endMonth = input(title="End Month", type=input.integer,
     defval=12, minval=1, maxval=12, group="BackTest Period")
_endYear = input(title="End Year", type=input.integer,
     defval=2031, minval=1800, maxval=2100, group="BackTest Period")

// Look if the close time of the current bar
// falls inside the date range
_inDateRange = (time >= timestamp(syminfo.timezone, _startYear,
         _startMonth, _startDate, 0, 0)) and
     (time < timestamp(syminfo.timezone, _endYear, _endMonth, _endDate, 0, 0))
  
//Alert configuration     

_alertMessageOpenLong="OpenLong"
_alertMessageCloseLong="CloseLong"
_alertmessageExitLong="ExitLong - TP/SL"

_alertMessageOpenShort="OpenShort"
_alertMessageCloseShort="CloseShort"
_alertMessageExitShort="ExitShort - TP/SL"

if (_inDateRange)
    //ENTER SOME SETUP TRADES FOR TSL EXAMPLE
    if (demaCrossover)
        strategy.entry("LONG", strategy.long, comment = _alertMessageOpenLong)
    if (demaCrossunder)
        strategy.entry("SHORT", strategy.short, comment = _alertMessageOpenShort)
    //EXIT TRADE @ TSL
    if strategy.position_size > 0
        strategy.exit("TP/SL", "LONG", stop=longStop, limit=longTake1Price, comment=_alertmessageExitLong, alert_message=_alertmessageExitLong)
    if strategy.position_size < 0
        strategy.exit("TP/SL", "SHORT", stop=shortStop, limit=shortTake1Price, comment =_alertMessageExitShort, alert_message=_alertMessageExitShort)


//Look & Feel - Plot stop loss and take profit areas
p1=plot(strategy.position_avg_price, color=color.blue, style=plot.style_linebr, linewidth=1, title="Preço de entrada")
p2=plot(series=strategy.position_size > 0 ? longStop : na, color=color.red, style=plot.style_linebr, linewidth=1, title="Long Stop")
p3=plot(series=strategy.position_size > 0 ? longTake1Price : na, color=color.green, style=plot.style_linebr, linewidth=1, title="Long TP")
p4=plot(series=strategy.position_size < 0 ? shortStop : na, color=color.red, style=plot.style_linebr, linewidth=1, title="Short Stop")
p5=plot(series=strategy.position_size < 0 ? shortTake1Price : na, color=color.green, style=plot.style_linebr, linewidth=1, title="Short TP")
fill(p1, p2, color=color.red)
fill(p1, p3, color=color.green)
fill(p1, p4, color=color.red)
fill(p1, p5, color=color.green)

// Insert label with value
stopLossOnLong = "Stop Loss = " + tostring(longStop)
stopLossOnShort = "Stop Loss = " + tostring(shortStop)
takeprofitOnLong = "Take Profit = " + tostring(longTake1Price)
takeprofitOnShort = "Take Profit = " + tostring(shortTake1Price)
precoentrada = "Entrada = " + tostring(strategy.position_avg_price)

var label FinalLabelpriceL = na
var label FinalLabelpriceS = na
var label slFinalLabelL = na
var label slFinalLabelS = na
var label slFinalLabelTPL = na
var label slFinalLabelTPS = na


//Draw entry and stop loss lines and labels

if strategy.position_size > 0   
    
    //write the price above the end of the stoploss line
    slFinalLabelL := label.new(bar_index, longStop, stopLossOnLong, style=label.style_none, size=size.normal, textcolor=color.red)
    slFinalLabelTPL := label.new(bar_index, longTake1Price, takeprofitOnLong, style=label.style_none, size=size.normal, textcolor=color.green)
    FinalLabelpriceL := label.new(bar_index, strategy.position_avg_price, precoentrada, style=label.style_none, size=size.normal, textcolor=color.blue)
    
    // Delete previous label when there is a consecutive new high, as there's no line plot in that case.
    if strategy.position_size > 0[1]
        label.delete(slFinalLabelL[1])
        label.delete(slFinalLabelTPL[1])
        label.delete(FinalLabelpriceL[1])

if strategy.position_size < 0   
    
    //write the price above the end of the stoploss line
    slFinalLabelS := label.new(bar_index, shortStop, stopLossOnShort, style=label.style_none, size=size.normal, textcolor=color.red)
    slFinalLabelTPS := label.new(bar_index, shortTake1Price, takeprofitOnShort, style=label.style_none, size=size.normal, textcolor=color.green)
    FinalLabelpriceS := label.new(bar_index, strategy.position_avg_price, precoentrada, style=label.style_none, size=size.normal, textcolor=color.blue)
    
    // Delete previous label when there is a consecutive new high, as there's no line plot in that case.
    if strategy.position_size < 0[1]
        label.delete(slFinalLabelS[1])
        label.delete(slFinalLabelTPS[1]) 
        label.delete(FinalLabelpriceS[1])

    
// Exit open market position when date range ends
if (not _inDateRange)
    strategy.close_all()