Estratégia de sinal de compra de filtro de compra de indicador duplo

Visão geral
A estratégia de compras de duplo indicador utiliza uma combinação de indicadores aleatórios como a média móvel lisinha (Stochastic RSI) e o indicador de faixa de Bryn para identificar potenciais oportunidades de compra. A estratégia usa várias condições de filtragem para distinguir os pontos de compra mais lucrativos. Isso permite identificar momentos de compra com alta probabilidade em ambientes de flutuação no mercado.
Princípio da estratégia
A estratégia usa dois conjuntos de indicadores para identificar oportunidades de compra.
Em primeiro lugar, ele usa um índice aleatório para determinar se o mercado está sobrevendido. O indicador, combinado com o índice aleatório e sua média móvel, é considerado um sinal de supervenda quando a linha% K atravessa sua linha% D a partir do ponto baixo.
Em segundo lugar, a estratégia usa um indicador de faixa de Brin para identificar mudanças de preço. A faixa de Brin é calculada em função do desvio padrão do preço. Quando o preço se aproxima do desvio padrão, está em estado de supervenda.
Depois de obter os sinais de oversell dos dois indicadores acima, a estratégia adiciona condições de filtragem múltiplas para identificar ainda mais os momentos de compra:
- Os preços acabaram de ultrapassar a barreira de Brin.
- O preço de fechamento atual é maior do que o preço de fechamento antes da linha N-K, mostrando a entrada de compra
- Preços de fechamento atuais abaixo dos preços de fechamento em períodos de revisão de longo prazo ou médio prazo, favoráveis à correção
O momento de compra identificado após o julgamento integrado, emite um sinal de compra.
Análise de vantagens
A estratégia de filtragem por dupla métrica tem algumas vantagens:
- A utilização de um julgamento de duplo indicador torna os sinais de compra mais confiáveis e evita falsos sinais.
- Os filtros são usados para evitar compras frequentes em situações de tremor.
- Combinado com um indicador de índice aleatório para determinar o estado de sobrevenda, o indicador de Binance para determinar a anormalidade do preço.
- Aumentar a capacidade de julgamento dos preços e garantir que haja um número suficiente de entradas e saídas.
- Aumentar o julgamento de retorno, garantindo ainda mais a credibilidade dos pontos de compra.
Em geral, a estratégia utiliza um conjunto de indicadores técnicos e meios de filtragem, permitindo uma identificação mais precisa e confiável do momento da compra, resultando em um melhor desempenho comercial.
Análise de Riscos
Embora haja muitos benefícios na estratégia de filtragem de duplas métricas, há alguns riscos que devem ser evitados:
- A configuração inadequada dos parâmetros pode levar a sinais de compra muito frequentes ou conservadores, que precisam ser cuidadosamente testados e otimizados.
- As condições de filtragem múltipla podem ter perdido algumas oportunidades de compra e impossibilitado o acompanhamento rápido.
- Quando o indicador é disperso, ele pode gerar um sinal de erro, o que requer atenção para a consistência do indicador.
- A falta de previsão de tendências pode gerar sinais errados em mercados em baixa, o que pode levar a perdas.
A estratégia pode ser otimizada de acordo com os riscos acima mencionados:
- Ajustar os parâmetros do indicador para equilibrar a sensibilidade das condições de filtragem.
- Ajuda a evitar sinais errados em mercados de baixa, com a ajuda de indicadores de tendência.
- Aumentar os meios de contenção de perdas.
Direção de otimização
A estratégia de filtragem de duplo indicador pode ser melhorada em várias dimensões:
- Teste mais combinações de indicadores técnicos para encontrar melhores meios de julgamento de tempo de compra. Como VRSI, DMI, etc.
- Adição de algoritmos de aprendizagem de máquina para otimizar automaticamente os parâmetros.
- Aumentar o mecanismo de stop loss adaptativo. Aumentar a linha de stop loss gradualmente quando o lucro atinge um determinado nível.
- A combinação de indicadores de volume de transações garante a existência de força de compra suficiente.
- Optimizar a estratégia de gestão de fundos. Configurar o número de transações dinâmicas para reduzir perdas individuais.
Ao introduzir mais tecnologias e métodos avançados, a estratégia de filtragem de duplo indicador permite uma escolha mais precisa do momento de compra e uma maior capacidade de controle de risco. Com isso, os ganhos são mais estáveis e confiáveis no mercado real.
Resumir
Em resumo, a estratégia de compra de sinal de compra de filtro de duplo indicador usa vários indicadores técnicos, como o RSI estocástico e a faixa de Bryn, e combina vários critérios de filtragem, como a força do preço e o julgamento de retração, para identificar um momento de compra confiável de alta probabilidade. Com a otimização de parâmetros, a configuração de stop loss e outros aperfeiçoamentos, a estratégia pode ser uma das estratégias de negociação quantitativa para a estabilidade de ganhos.
A sua principal vantagem reside na combinação eficaz de indicadores e condições de filtragem, permitindo um julgamento mais preciso do momento da compra. O risco e a direção de otimização também podem ser controlados e resolvidos. No geral, é uma estratégia de quantificação altamente eficiente que pode ser implementada.
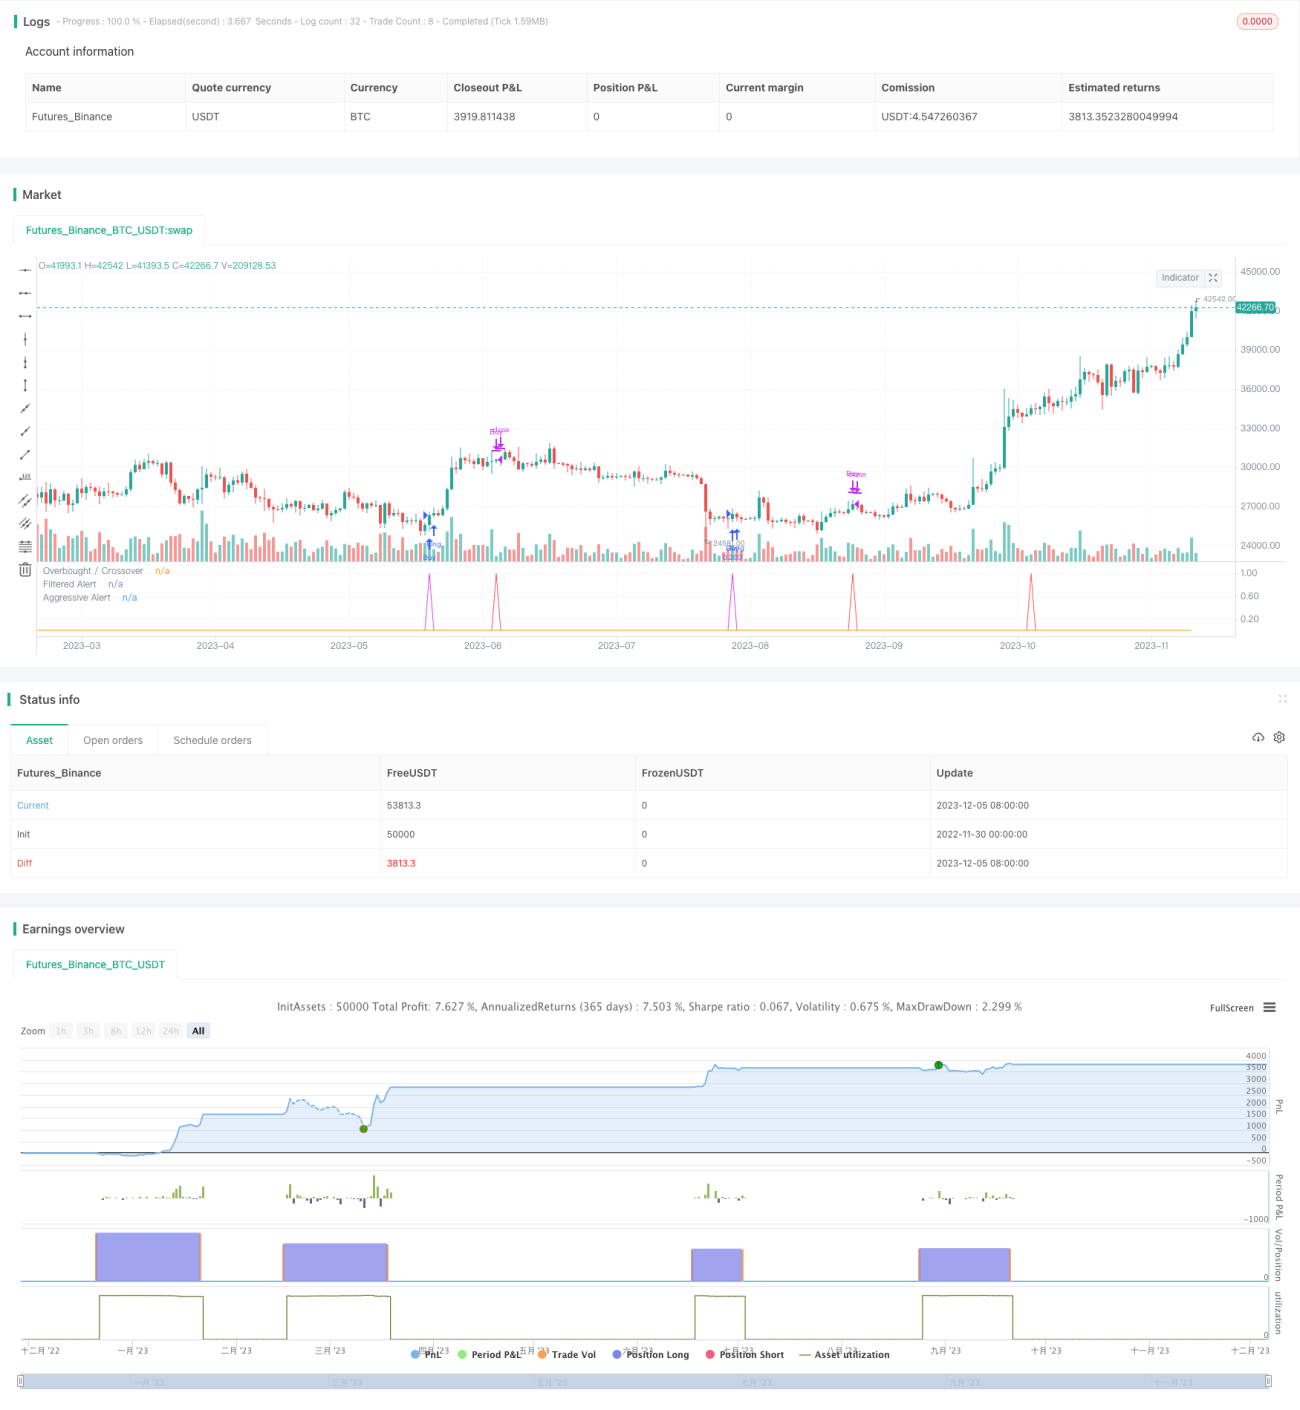
/*backtest
start: 2022-11-30 00:00:00
end: 2023-12-06 00:00:00
period: 1d
basePeriod: 1h
exchanges: [{"eid":"Futures_Binance","currency":"BTC_USDT"}]
*/

//@version=4
strategy("SORAN Buy and Close Buy", pyramiding=1, initial_capital=10000, default_qty_type=strategy.percent_of_equity, default_qty_value=10, overlay=false)

////Buy and Close-Buy messages- 1