Стратегия пересечения скользящих средних с двойной EMA

Обзор
Двойная средняя линия EMA-пересечения является одной из наиболее распространенных стратегий отслеживания тенденций. Эта стратегия использует среднюю линию EMA двух различных периодов, чтобы получить сигнал покупки, когда она пересекает долгосрочную EMA на коротком периоде EMA, и сигнал продажи, когда она пересекает долгосрочную EMA на коротком периоде EMA, чтобы уловить изменения в ценовой тенденции.
Стратегический принцип
Основная логика этой стратегии основана на принципе металлических винтовых точек средней линии EMA. Средняя линия EMA может эффективно сглаживать данные о ценах, указывая направление тренда. Короткопериодическая линия EMA более быстро реагирует на изменения цен, а долгопериодическая линия EMA относительно нечувствительна к шуму и может отражать долгосрочную тенденцию.
В частности, эта стратегия использует параметры length1 и length2 для установки длины двух средних линий EMA. DemaVal1 - это средняя линия EMA длиной length1, а demaVal2 - средняя линия EMA длиной length2.
mylang
demaVal1 = EMA(close, length1)
demaVal2 = EMA(close, length2)
где EMA ((() - это функция, которая вычисляет среднюю линию EMA. Когда demaVal1 пересекает demaVal2, то генерируется сигнал покупки demaCrossover, а когда пересекает demaCrossunder, то генерируется сигнал продажи demaCrossunder. Стратегия выпускает торговые инструкции на основе этих двух сигналов.
Стратегические преимущества
Эта стратегия имеет следующие преимущества:
- Стратегическая логика проста, понятна и легко реализуема.
- Теория равнолинейного скрещивания является зрелой и широко применяется.
- Конфигурируемые параметры имеют гибкую длину и могут применяться в различных рыночных условиях.
- Повышение эффективности стратегии путем оптимизации параметров.
Риск и оптимизация
Однако эта стратегия также несет в себе некоторые риски:
- Частые ложные сигналы могут возникать при перекрестных EMA-сигналах, когда рынок не в тренде.
- Параметры по умолчанию могут не применяться для всех сортов и должны быть оптимизированы с учетом исторических данных.
В зависимости от вышеуказанных рисков можно оптимизировать следующие аспекты:
- Адаптировать параметры EMA к различным циклическим условиям.
- Добавить фильтрационные условия, чтобы избежать ложных сигналов. Например, соответствующие показатели преимущества, показатели объема сделки и т. Д.
- Повышение эффективности стратегии в сочетании с техническими показателями, такими как тенденции, поддержка резистентности.
Подвести итог
Двойная стратегия равнолинейного перекрёстка EMA в целом является простой и практичной стратегией для отслеживания тенденций. Она унаследовала устоявшуюся теорию равнолинейного перекрёстного анализа и при условии корректировки параметров и оптимизации условий фильтрации может применяться для торговли тенденциями различных сортов, имея хорошие перспективы применения.
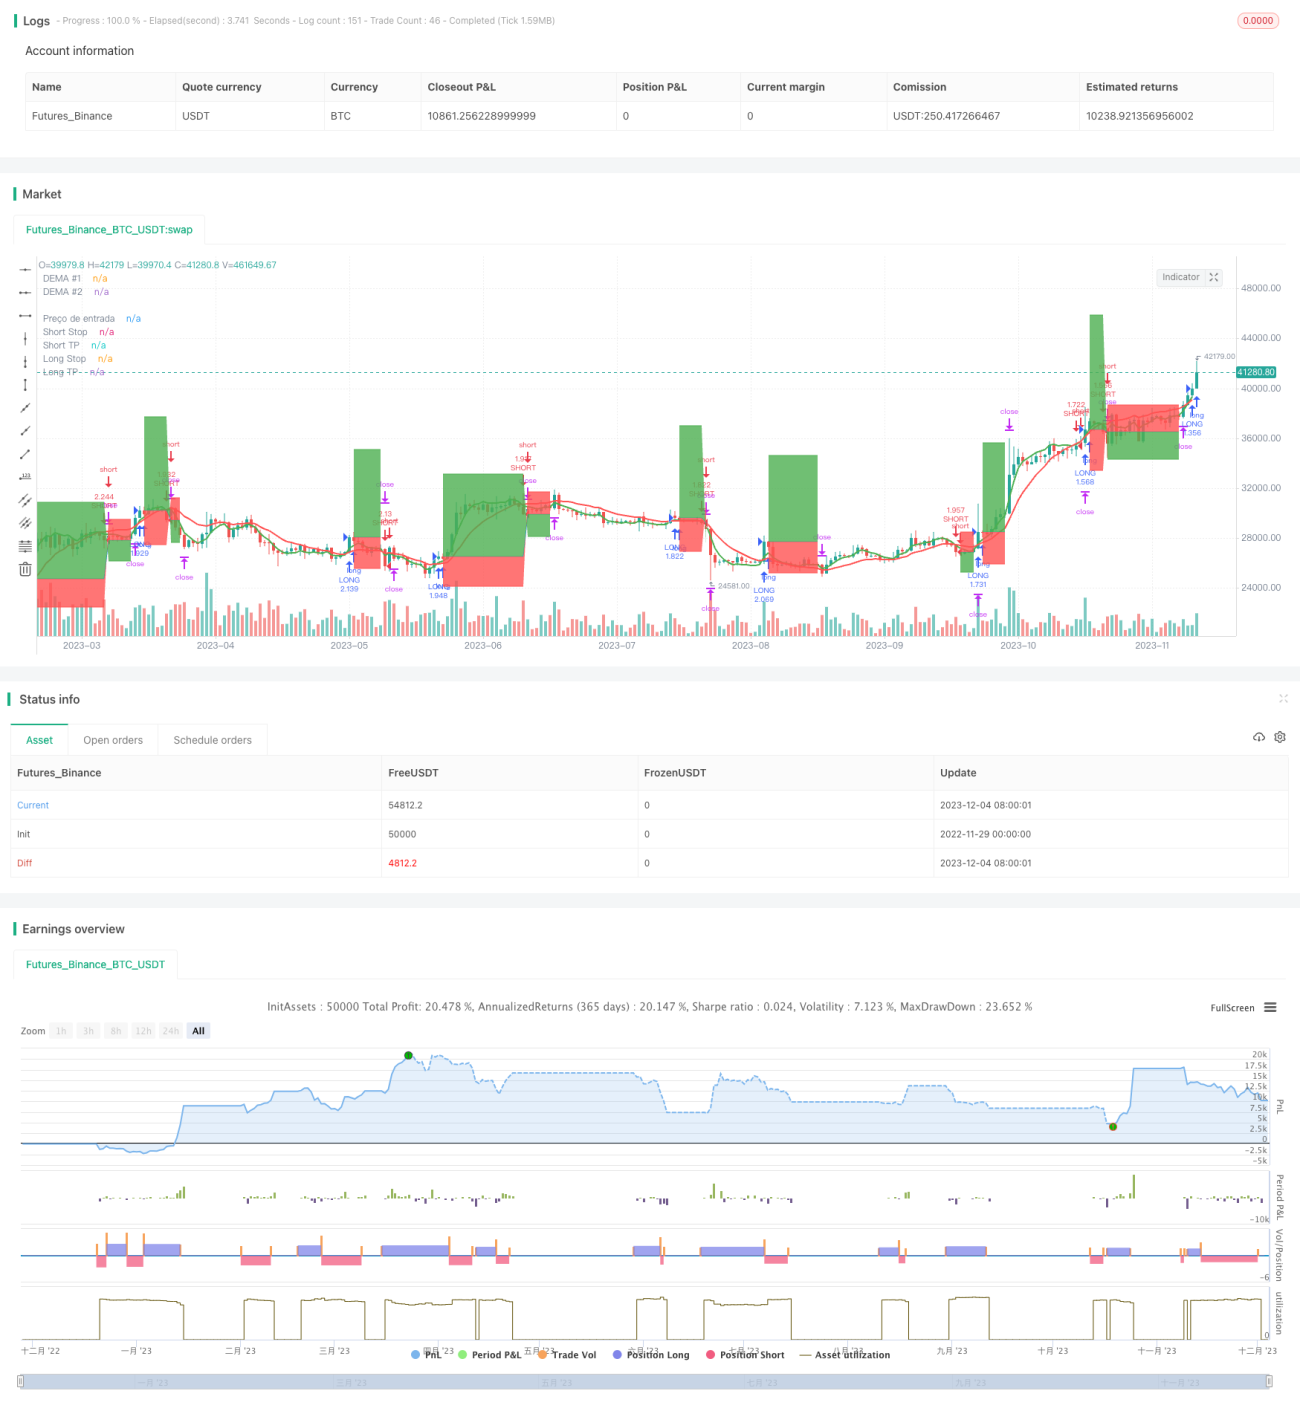
/*backtest
start: 2022-11-29 00:00:00
end: 2023-12-05 00:00:00
period: 1d
basePeriod: 1h
exchanges: [{"eid":"Futures_Binance","currency":"BTC_USDT"}]
*/

// This source code is subject to the terms of the Mozilla Public License 2.0 at https://mozilla.org/MPL/2.0/
// © zeguela
//@version=4
strategy(title="ZEGUELA DEMABOT", commission_value=0.063, commission_type=strategy.commission.percent, initial_capital=100, default_qty_value=90, default_qty_type=strategy.percent_of_equity, overlay=true, process_orders_on_close=true)- 1