ڈبل ای ایم اے موونگ ایوریج کراس اوور حکمت عملی

جائزہ
ڈبل ای ایم اے اوسط لائن کراسنگ حکمت عملی ایک عام طور پر استعمال ہونے والی ٹرینڈ ٹریکنگ حکمت عملی ہے۔ اس حکمت عملی میں دو مختلف دورانیے کی ای ایم اے اوسط لائن کا استعمال کیا جاتا ہے ، جس سے خریدنے کا اشارہ پیدا ہوتا ہے جب مختصر دورانیے کی ای ایم اے پر طویل دورانیے کی ای ایم اے سے گزرتا ہے ، اور فروخت کا اشارہ پیدا ہوتا ہے جب مختصر دورانیے کی ای ایم اے پر طویل دورانیے کی ای ایم اے سے گزرتا ہے ، قیمت کے رجحان میں تبدیلی کو پکڑنے کے لئے۔
حکمت عملی کا اصول
اس حکمت عملی کا بنیادی منطق ای ایم اے کی اوسط لائن پر مبنی ہے۔ ای ایم اے کی اوسط لائن قیمت کے اعداد و شمار کو مؤثر طریقے سے ہموار کرنے اور رجحان کی سمت کی نشاندہی کرنے کے قابل ہے۔ قلیل مدتی ای ایم اے لائن قیمت کی تبدیلیوں کا تیزی سے جواب دیتی ہے ، جبکہ طویل مدتی ای ایم اے لائن شور کے لئے نسبتا غیر حساس ہے ، جو طویل مدتی رجحان کی عکاسی کرتی ہے۔ جب قلیل مدتی ای ایم اے پر طویل مدتی ای ایم اے ہوتا ہے تو ، اس کو قیمت میں اضافے کی رفتار کے طور پر دیکھا جاتا ہے۔ جب قلیل مدتی ای ایم اے پر طویل مدتی ای ایم اے ہوتا ہے تو ، اسے قیمت میں کمی کی رفتار کے طور پر دیکھا جاتا ہے۔ اس اصول کے مطابق حکمت عملی خریدنے اور بیچنے کے سگنل جاری کرتی ہے۔
خاص طور پر ، یہ حکمت عملی length1 اور length2 پیرامیٹرز کا استعمال کرتے ہوئے دو EMA میڈین لائنوں کی لمبائی طے کرتی ہے۔ ڈیما وی ایل 1 ای ایم اے میڈین لائن کی لمبائی لمبائی 1 ہے ، اور ڈیما وی ایل 2 ای ایم اے میڈین لائن کی لمبائی لمبائی 2 ہے۔ دونوں کا حساب کتاب اس طرح ہے:
mylang
demaVal1 = EMA(close, length1)
demaVal2 = EMA(close, length2)
اس میں EMA ((() EMA کی اوسط لائن کا حساب لگانے کا ایک فنکشن ہے۔ demaVal1 پر demaVal2 کو پار کرتے وقت خریدنے کا اشارہ demaCrossover پیدا ہوتا ہے ، اور جب اس کو پار کرتے وقت فروخت کرنے کا اشارہ demaCrossunder پیدا ہوتا ہے۔ حکمت عملی ان دونوں سگنلوں کے مطابق تجارتی ہدایات جاری کرتی ہے۔
اسٹریٹجک فوائد
یہ حکمت عملی مندرجہ ذیل فوائد رکھتی ہے:
- حکمت عملی کی منطق سادہ ہے، سمجھنے میں آسان ہے، اور اسے نافذ کرنا آسان ہے۔
- مساوی لکیری کراسنگ تھیوری پختہ ہے اور اس کا استعمال وسیع پیمانے پر ہوتا ہے۔
- مختلف مارکیٹ کے حالات کے لئے لچکدار ترتیب کے طول و عرض.
- آپٹمائزڈ پیرامیٹرز کے ذریعے حکمت عملی کی تاثیر کو بہتر بنایا جاسکتا ہے۔
خطرہ اور اصلاح
اس حکمت عملی کے کچھ خطرات بھی ہیں:
- ای ایم اے کراس سگنل میں اکثر غلط سگنل ہوسکتے ہیں جب مارکیٹ غیر رجحان میں ہے۔
- پہلے سے طے شدہ پیرامیٹرز تمام اقسام پر لاگو نہیں ہوسکتے ہیں اور تاریخی اعداد و شمار پر مبنی اہداف کو بہتر بنانے کی ضرورت ہے۔
مندرجہ بالا خطرات کے مطابق، آپ کو مندرجہ ذیل پہلوؤں میں بہتر بنانے کے لئے استعمال کیا جا سکتا ہے:
- مختلف دورانیہ کے حالات کے مطابق ای ایم اے کی سائیکل پیرامیٹرز کو ایڈجسٹ کریں۔
- فلٹرنگ کی شرائط میں اضافہ کریں تاکہ غلط سگنلوں سے بچا جاسکے۔ مثال کے طور پر فٹنس فضیلت کے اشارے ، تجارت کے حجم کے اشارے وغیرہ۔
- رجحانات اور معاون مزاحمت کی سطح جیسے تکنیکی اشارے کے ساتھ مل کر ، حکمت عملی کی تاثیر کو بہتر بنائیں۔
خلاصہ کریں۔
ڈبل ای ایم اے مساوی لائن کراسنگ حکمت عملی مجموعی طور پر ایک سادہ عملی رجحان کی پیروی کرنے والی حکمت عملی ہے۔ اس نے مساوی لائن کراسنگ تجزیہ کی پختہ تھیوری کو وراثت میں حاصل کیا ہے۔ پیرامیٹرز کو ایڈجسٹ کرنے اور فلٹرنگ کی شرائط کو بہتر بنانے کی شرط پر ، یہ مختلف اقسام کے رجحانات کی تجارت کے لئے موزوں ہے۔
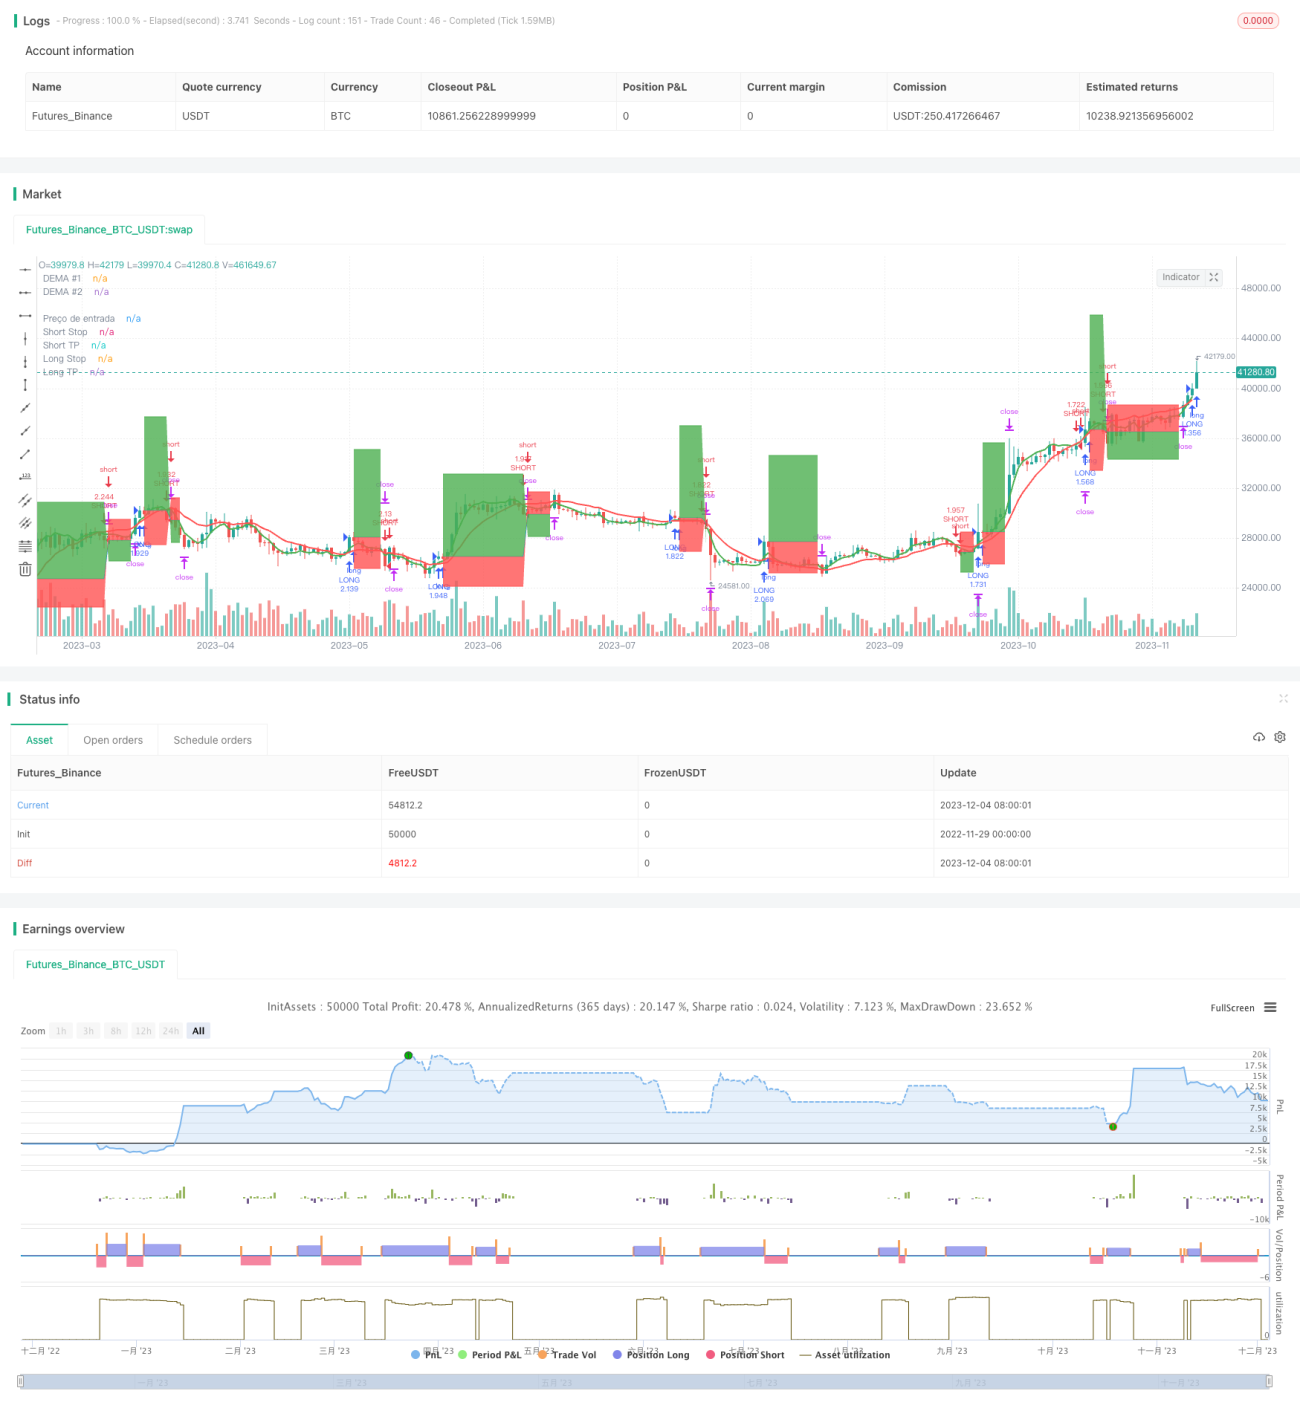
/*backtest
start: 2022-11-29 00:00:00
end: 2023-12-05 00:00:00
period: 1d
basePeriod: 1h
exchanges: [{"eid":"Futures_Binance","currency":"BTC_USDT"}]
*/

// This source code is subject to the terms of the Mozilla Public License 2.0 at https://mozilla.org/MPL/2.0/
// © zeguela
//@version=4
strategy(title="ZEGUELA DEMABOT", commission_value=0.063, commission_type=strategy.commission.percent, initial_capital=100, default_qty_value=90, default_qty_type=strategy.percent_of_equity, overlay=true, process_orders_on_close=true)- 1