
Chiến lược giao chéo đường trung bình EMA kép là một chiến lược theo dõi xu hướng phổ biến. Chiến lược này sử dụng đường trung bình EMA của hai chu kỳ khác nhau để tạo ra tín hiệu mua khi EMA chu kỳ ngắn đi qua EMA chu kỳ dài và tạo ra tín hiệu bán khi EMA chu kỳ ngắn đi qua EMA chu kỳ dài để nắm bắt sự thay đổi của xu hướng giá.
Lập luận cốt lõi của chiến lược này dựa trên nguyên tắc ngắt quãng kim loại của đường trung bình EMA. đường trung bình EMA có thể làm mỏng dữ liệu giá một cách hiệu quả, gợi ý hướng xu hướng. đường EMA ngắn hạn có thể phản ứng nhanh hơn với biến động giá, trong khi đường EMA dài hạn tương đối không nhạy cảm với tiếng ồn, có thể phản ánh xu hướng dài hạn.
Cụ thể, chiến lược này sử dụng các tham số length1 và length2 để thiết lập chiều dài của hai đường trung bình EMA. DemaVal1 là đường trung bình EMA có chiều dài 1 và demaVal2 là đường trung bình EMA có chiều dài 2.
demaVal1 = EMA(close, length1)
demaVal2 = EMA(close, length2)
Trong đó EMA (()) là hàm tính EMA đường trung bình. Khi demaVal1 vượt qua demaVal2 tạo ra tín hiệu mua demaCrossover, khi vượt qua nó tạo ra tín hiệu bán demaCrossunder. Chiến lược phát hành lệnh giao dịch dựa trên hai tín hiệu này.
Chiến lược này có những ưu điểm sau:
Chiến lược này cũng có một số rủi ro:
Theo các rủi ro trên, có thể tối ưu hóa theo các khía cạnh sau:
Chiến lược giao chéo đồng tuyến EMA kép là một chiến lược theo dõi xu hướng đơn giản và thực tế. Nó thừa hưởng lý thuyết đã được xác định của phân tích giao chéo đồng tuyến và có thể được áp dụng cho các giao dịch xu hướng khác nhau, với triển vọng ứng dụng tốt, với điều kiện điều chỉnh tham số và tối ưu hóa điều kiện lọc.
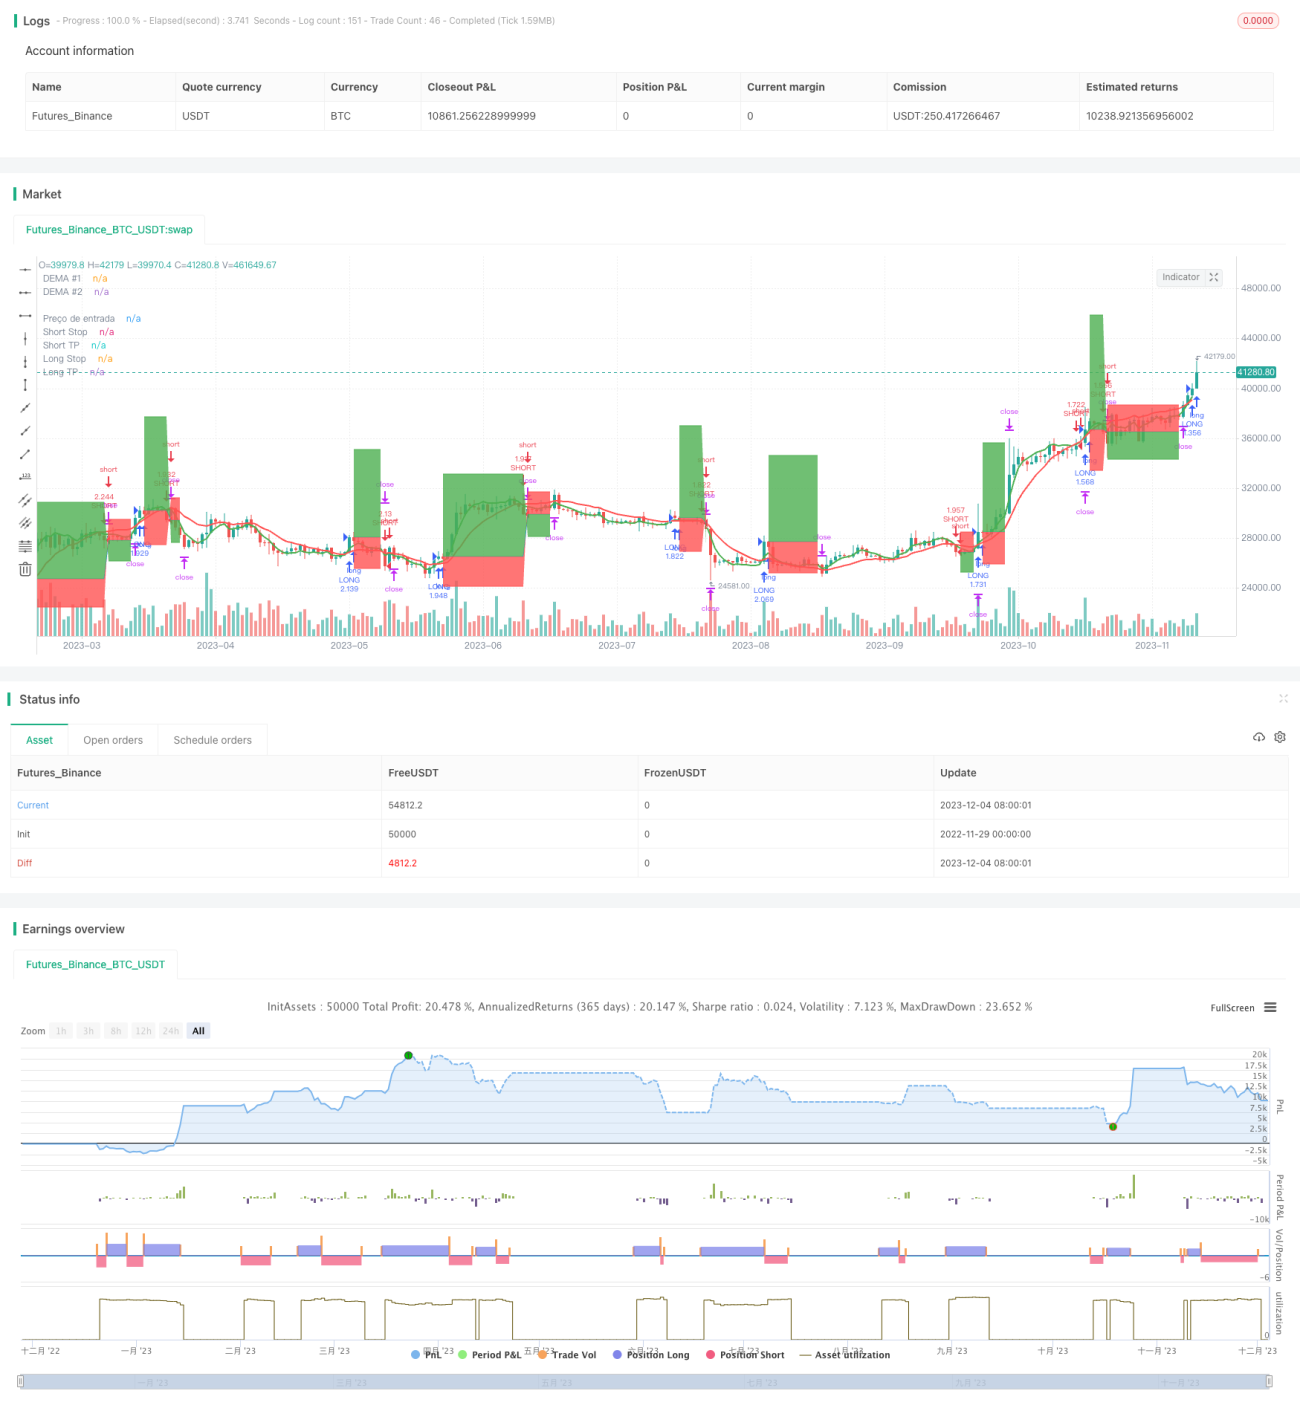
/*backtest
start: 2022-11-29 00:00:00
end: 2023-12-05 00:00:00
period: 1d
basePeriod: 1h
exchanges: [{"eid":"Futures_Binance","currency":"BTC_USDT"}]
*/
// This source code is subject to the terms of the Mozilla Public License 2.0 at https://mozilla.org/MPL/2.0/
// © zeguela
//@version=4
strategy(title="ZEGUELA DEMABOT", commission_value=0.063, commission_type=strategy.commission.percent, initial_capital=100, default_qty_value=90, default_qty_type=strategy.percent_of_equity, overlay=true, process_orders_on_close=true)
// Step 1. Script settings
// Input options
srcData = input(title="Source Data", type=input.source, defval=close)
// Length settings
len1 = input(title="Length DEMA #1", type=input.integer, defval=8, minval=1)
len2 = input(title="Length DEMA #2", type=input.integer, defval=24, minval=0)
len3 = input(title="Length DEMA #3", type=input.integer, defval=0, minval=0)
// Step 2. Calculate indicator values
// Function that calculates the DEMA
DEMA(series, length) =>
if (length > 0)
emaValue = ema(series, length)
2 * emaValue - ema(emaValue, length)
else
na
// Calculate the DEMA values
demaVal1 = DEMA(srcData, len1)
demaVal2 = DEMA(srcData, len2)
demaVal3 = DEMA(srcData, len3)
// Step 3. Determine indicator signals
// See if there's a DEMA crossover
demaCrossover = if (len2 > 0) and (len3 > 0)
crossover(demaVal1, demaVal2) and (demaVal3 > demaVal3[1])
else
if (len2 > 0) and (len3 == 0)
crossover(demaVal1, demaVal2)
else
if (len3 > 0) and (len2 == 0)
crossover(demaVal1, demaVal3)
else
crossover(close, demaVal1)
// Check if there's a DEMA crossunder
demaCrossunder = if (len2 > 0) and (len3 > 0)
crossunder(demaVal1, demaVal2) and (demaVal3 < demaVal3[1])
else
if (len2 > 0) and (len3 == 0)
crossunder(demaVal1, demaVal2)
else
if (len3 > 0) and (len2 == 0)
crossunder(demaVal1, demaVal3)
else
crossunder(close, demaVal1)
// Step 4. Output indicator data
// Plot DEMAs on the chart
plot(series=demaVal1, color=color.green, linewidth=2, title="DEMA #1")
plot(series=demaVal2, color=color.red, linewidth=2, title="DEMA #2")
plot(series=demaVal3, color=color.fuchsia, linewidth=2, title="DEMA #3")
//TRAILING STOP CODE
a = input(title="Usar Trailing Stop?", type=input.bool, defval=false)
stopPerlong = input(9.0, title='Stop Loss Long %', type=input.float, group="Stop Loss & Take Profit Settings") / 100
stopPershort = input(6.0, title='Stop Loss Short %', type=input.float, group="Stop Loss & Take Profit Settings") / 100
take1Perlong = input(25.0, title='Take Profit Long % 1', type=input.float, group="Stop Loss & Take Profit Settings") / 100
take1Pershort = input(6.0, title='Take Profit Short % 1', type=input.float, group="Stop Loss & Take Profit Settings") / 100
// Determine stop loss price
longStopPrice = strategy.position_avg_price * (1 - stopPerlong)
shortStopPrice = strategy.position_avg_price * (1 + stopPershort)
longTake1Price = strategy.position_avg_price * (1 + take1Perlong)
shortTake1Price = strategy.position_avg_price * (1 - take1Pershort)
// Determine trail stop loss prices
longStopPriceTrail = 0.0
longStopPriceTrail := if (strategy.position_size > 0)
stopValue = close * (1 - stopPerlong)
max(stopValue, longStopPriceTrail[1])
else
0
// Determine trailing short price
shortStopPriceTrail = 0.0
shortStopPriceTrail := if (strategy.position_size < 0)
stopValue = close * (1 + stopPershort)
min(stopValue, shortStopPriceTrail[1])
else
999999
//calcular qual stop usar
longStop = a ? longStopPriceTrail : longStopPrice
shortStop = a ? shortStopPriceTrail : shortStopPrice
//calcula o valor do stop e TP pra lançar no alerta
longStopEntrada = close * (1 - stopPerlong)
shortStopEntrada = close * (1 + stopPershort)
longTPEntrada = close * (1 + take1Perlong)
shortTPEntrada = close * (1 - take1Pershort)
//armazena o preço de entrada e valor do SL e TP
price_entryL = 0.0
price_entryL := na(price_entryL) ? na : price_entryL[1]
price_entryS = 0.0
price_entryS := na(price_entryS) ? na : price_entryS[1]
stopL = 0.0
stopL := na(stopL) ? na : stopL[1]
stopS = 0.0
stopS := na(stopS) ? na : stopS[1]
takeL = 0.0
takeL := na(takeL) ? na : takeL[1]
takeS = 0.0
takeS := na(takeS) ? na : takeS[1]
if (demaCrossover)
price_entryL := close
stopL := close * (1 - stopPerlong)
takeL := close * (1 + take1Perlong)
if (demaCrossunder)
price_entryS := close
stopS := close * (1 + stopPershort)
takeS := close * (1 - take1Pershort)
resultadoL = ((close - price_entryL)/price_entryL) * 100
resultadoLexit = "(SL = 1% e TP = 0,5%)"
resultadoS = ((price_entryS - close)/price_entryS) * 100
resultadoSexit = "(SL = 1% e TP = 0,5)%"
// Make input options that configure backtest date range
_startDate = input(title="Start Date", type=input.integer,
defval=1, minval=1, maxval=31, group="BackTest Period")
_startMonth = input(title="Start Month", type=input.integer,
defval=1, minval=1, maxval=12, group="BackTest Period")
_startYear = input(title="Start Year", type=input.integer,
defval=2018, minval=1800, maxval=2100, group="BackTest Period")
_endDate = input(title="End Date", type=input.integer,
defval=31, minval=1, maxval=31, group="BackTest Period")
_endMonth = input(title="End Month", type=input.integer,
defval=12, minval=1, maxval=12, group="BackTest Period")
_endYear = input(title="End Year", type=input.integer,
defval=2031, minval=1800, maxval=2100, group="BackTest Period")
// Look if the close time of the current bar
// falls inside the date range
_inDateRange = (time >= timestamp(syminfo.timezone, _startYear,
_startMonth, _startDate, 0, 0)) and
(time < timestamp(syminfo.timezone, _endYear, _endMonth, _endDate, 0, 0))
//Alert configuration
_alertMessageOpenLong="OpenLong"
_alertMessageCloseLong="CloseLong"
_alertmessageExitLong="ExitLong - TP/SL"
_alertMessageOpenShort="OpenShort"
_alertMessageCloseShort="CloseShort"
_alertMessageExitShort="ExitShort - TP/SL"
if (_inDateRange)
//ENTER SOME SETUP TRADES FOR TSL EXAMPLE
if (demaCrossover)
strategy.entry("LONG", strategy.long, comment = _alertMessageOpenLong)
if (demaCrossunder)
strategy.entry("SHORT", strategy.short, comment = _alertMessageOpenShort)
//EXIT TRADE @ TSL
if strategy.position_size > 0
strategy.exit("TP/SL", "LONG", stop=longStop, limit=longTake1Price, comment=_alertmessageExitLong, alert_message=_alertmessageExitLong)
if strategy.position_size < 0
strategy.exit("TP/SL", "SHORT", stop=shortStop, limit=shortTake1Price, comment =_alertMessageExitShort, alert_message=_alertMessageExitShort)
//Look & Feel - Plot stop loss and take profit areas
p1=plot(strategy.position_avg_price, color=color.blue, style=plot.style_linebr, linewidth=1, title="Preço de entrada")
p2=plot(series=strategy.position_size > 0 ? longStop : na, color=color.red, style=plot.style_linebr, linewidth=1, title="Long Stop")
p3=plot(series=strategy.position_size > 0 ? longTake1Price : na, color=color.green, style=plot.style_linebr, linewidth=1, title="Long TP")
p4=plot(series=strategy.position_size < 0 ? shortStop : na, color=color.red, style=plot.style_linebr, linewidth=1, title="Short Stop")
p5=plot(series=strategy.position_size < 0 ? shortTake1Price : na, color=color.green, style=plot.style_linebr, linewidth=1, title="Short TP")
fill(p1, p2, color=color.red)
fill(p1, p3, color=color.green)
fill(p1, p4, color=color.red)
fill(p1, p5, color=color.green)
// Insert label with value
stopLossOnLong = "Stop Loss = " + tostring(longStop)
stopLossOnShort = "Stop Loss = " + tostring(shortStop)
takeprofitOnLong = "Take Profit = " + tostring(longTake1Price)
takeprofitOnShort = "Take Profit = " + tostring(shortTake1Price)
precoentrada = "Entrada = " + tostring(strategy.position_avg_price)
var label FinalLabelpriceL = na
var label FinalLabelpriceS = na
var label slFinalLabelL = na
var label slFinalLabelS = na
var label slFinalLabelTPL = na
var label slFinalLabelTPS = na
//Draw entry and stop loss lines and labels
if strategy.position_size > 0
//write the price above the end of the stoploss line
slFinalLabelL := label.new(bar_index, longStop, stopLossOnLong, style=label.style_none, size=size.normal, textcolor=color.red)
slFinalLabelTPL := label.new(bar_index, longTake1Price, takeprofitOnLong, style=label.style_none, size=size.normal, textcolor=color.green)
FinalLabelpriceL := label.new(bar_index, strategy.position_avg_price, precoentrada, style=label.style_none, size=size.normal, textcolor=color.blue)
// Delete previous label when there is a consecutive new high, as there's no line plot in that case.
if strategy.position_size > 0[1]
label.delete(slFinalLabelL[1])
label.delete(slFinalLabelTPL[1])
label.delete(FinalLabelpriceL[1])
if strategy.position_size < 0
//write the price above the end of the stoploss line
slFinalLabelS := label.new(bar_index, shortStop, stopLossOnShort, style=label.style_none, size=size.normal, textcolor=color.red)
slFinalLabelTPS := label.new(bar_index, shortTake1Price, takeprofitOnShort, style=label.style_none, size=size.normal, textcolor=color.green)
FinalLabelpriceS := label.new(bar_index, strategy.position_avg_price, precoentrada, style=label.style_none, size=size.normal, textcolor=color.blue)
// Delete previous label when there is a consecutive new high, as there's no line plot in that case.
if strategy.position_size < 0[1]
label.delete(slFinalLabelS[1])
label.delete(slFinalLabelTPS[1])
label.delete(FinalLabelpriceS[1])
// Exit open market position when date range ends
if (not _inDateRange)
strategy.close_all()