Quantitativer Handel mit Candlestick-Mustern und Trendfolgestrategien
Überblick
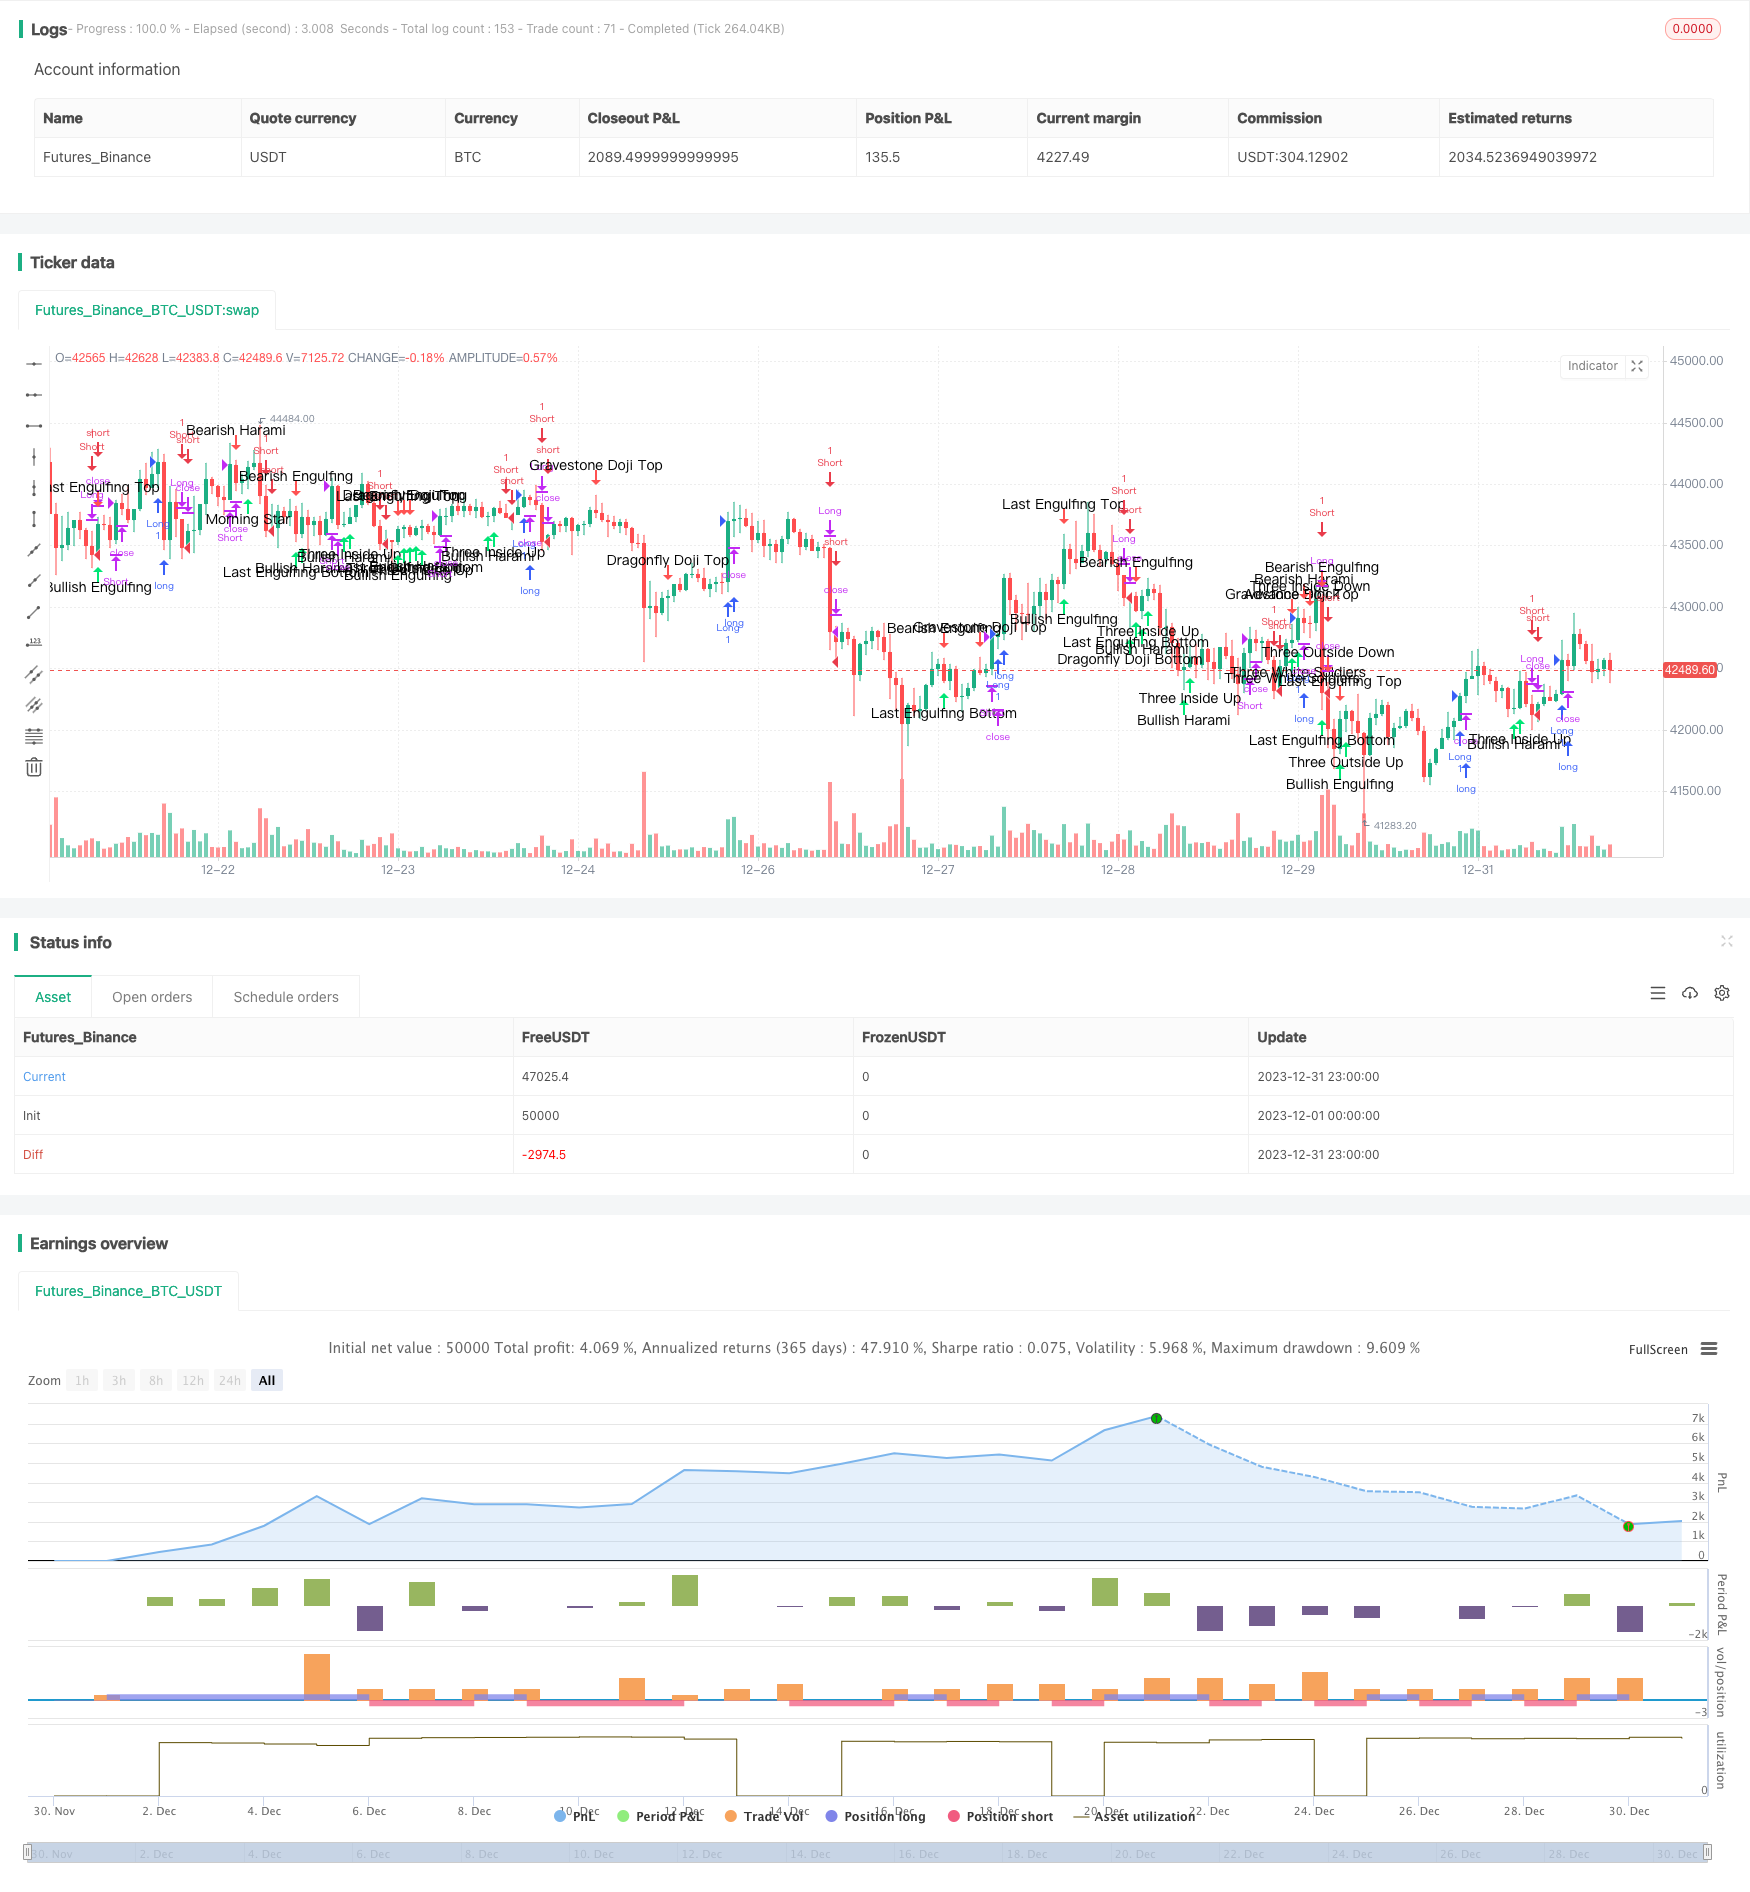
Die Strategie wird als “Quantifizierung von Handelsmargen und Trendverfolgung” bezeichnet. Die Strategie kombiniert die Analyse von Margen und die Strategie der Trendverfolgung.
Die Strategie basiert hauptsächlich auf der Identifizierung verschiedener Anhaltspunkte, um die derzeitige Marktlage und mögliche Wendepunkte zu beurteilen. In Kombination mit der Verfolgung der Höchst- und Tiefstpreise bilden sich Ein- und Ausstiegssignale, um die Preisentwicklung der mittleren und langen Linie zu erfassen.
Strategieprinzip
Die Strategie besteht aus folgenden Modulen:
- Das Urteil der Form
Die Strategie definiert zunächst die Elemente der Anlage wie Objekte, Schattenlinien usw. und legt Parameter fest, mit denen mehr als 40 häufige Anlageformen wie Kreuzstern, Sternschnuppen und drei innere Aufstiege identifiziert werden können. Wenn diese Formen identifiziert werden, werden sie als Mehrkopf- oder Leerkopfsignale markiert und beurteilt.
- Trends beurteilen
Die Strategie nutzt die Beobachtung von Höchst- und Tiefstpreisen, um Trends zu ermitteln. Wenn der Preis den Höchstpreis über N Tage überschreitet, wird er als Aufwärtstrend beurteilt, wenn der Preis den Tiefstpreis über N Tage unterbricht, wird er als Off-Road-Trend beurteilt.
- Eintritt und Ausstieg
Die Eintritts- und Ausstiegsregeln bilden sich aus dem Multi-Hochsymbol-Signal, das durch die Trend-Beschlüsse in Kombination mit dem Durchbruch des Höchst- und Tiefstpreises bestimmt wird.
Zum Beispiel, wenn Sie mehrere Kopf-Kopf-Formen wie die Ananas-Leine identifizieren, und der Preis über dem N-Tages-Höchstpreis ist, machen Sie mehr; wenn der Preis unter dem N-Tages-Tiefpreis fällt, schließen Sie mehr.
- Erfassungsbereich
Die Strategie schließt schließlich die gesamte Strategie-Logik ab, indem sie die Start-End-Zeit der Rückmessung festlegt.
Analyse der Stärken
Die Strategie hat folgende Vorteile:
- Kombination von Formen und Trends
Die Vorteile der Kombination aus Trendbeurteilung und Trendbeurteilung können sowohl zur Beurteilung eines möglichen Preiswendepunktes als auch zur Ermittlung des Zeitpunkt der Einführung durch Trends genutzt werden.
- Vielfältige Form der Identifikation
Die Strategie beinhaltet die Identifizierung von mehr als 40 häufigen Anlagemethoden, eine breite Abdeckung und die Identifizierung von mehr potenziellen Handelsmöglichkeiten in verschiedenen Marktumgebungen.
- Hohe Parameteranpassungsfähigkeit
Die Parameter der Strategie, wie die Anzahl der Tage, die Formen der Identifizierung, können selbstständig angepasst werden, sind anpassungsfähig und lassen sich leichter für bestimmte Märkte anpassen.
- Erweiterbar
Es ist möglich, weitere Formenerkennungsmodule direkt auf die vorhandene Logik zu erweitern oder weitere Faktorentscheidungsmodule hinzuzufügen, um die Effektivität der Strategie weiter zu optimieren.
Risikoanalyse
Die Strategie birgt auch folgende Risiken:
- Die Formerkennung ist nicht zu 100% korrekt.
Die Analogie ist nicht vollständig korrekt, es besteht eine gewisse Wahrscheinlichkeit einer Fehlinterpretation, und es kann vorkommen, dass ein Handelssignal versehentlich ausgelöst wird.
- Fehlen von Stop-Loss-Modulen
Derzeit gibt es keine Stop-Loss-Logik in der Strategie und es ist unmöglich, einzelne Verluste effektiv zu kontrollieren. Wenn die Trendentscheidung fehlschlägt, kann dies zu größeren Verlusten für die Konten führen.
- Risiko der Datengerechtigkeit
Die aktuelle Strategie wirkt möglicherweise mit einer gewissen Anpassung an die Daten innerhalb der Rückmessstrecke und die Leistung im realen Bereich kann abnehmen.
Optimierungsrichtung
Die wichtigsten Optimierungsmöglichkeiten der Strategie sind:
- Hinzufügen von Stop-Loss-Modulen
Erhöhung der Stop-Loss-Strategie, wie z. B. mobile Stop-Loss, Prozentsatz Stop-Loss, um das Risiko effektiv zu kontrollieren und den maximalen Einzelschaden zu begrenzen.
- Maschinelles Lernen zur Verbesserung der Formenschätzung
Modelle mit Machine Learning-Algorithmen werden trainiert, um die Genauigkeit der Antennenform zu verbessern und die Fehlsignalrate zu senken.
- Mehrmarktprüfung
Die Strategie soll in weiteren Märkten wie den Devisen- und Kryptowährungsmärkten getestet werden, um Rückmeldungen zu verhindern.
- Mehr Faktoren zusammen
Die Einführung von mehr quantifizierbaren Faktoren, wie beispielsweise Quantitative Preisindizes, Kapitalflussindizes usw., kann die Strategielogik bereichern und die Stabilität verbessern.
Zusammenfassen
Insgesamt kann die Strategie, in Kombination mit dem Trendverfolgungsgeschäft und dem Trendverfolgungsgeschäft, die Preisentwicklung erfassen und zusätzliche Gewinne erzielen, während die Marktwendepunkte beurteilt werden. Die Strategie hat einen großen Optimierungsraum und kann durch Risikokontrolle, Maschinelles Lernen, Multifaktoren usw. verbessert werden, was die Strategie robuster und wirtschaftlicher macht.
/*backtest
start: 2023-12-01 00:00:00
end: 2023-12-31 23:59:59
period: 1h
basePeriod: 15m
exchanges: [{"eid":"Futures_Binance","currency":"BTC_USDT"}]
*/

//@version=3
strategy("Candle analysis & long/short strategy (HF) inspired by TurtleBC", shorttitle="TurtleBC-V.Troussel", overlay=true,initial_capital=1000)

//VARIABLES
body=close-open
range=high-low
middle=(open+close)/2
abody=abs(body)
ratio=abody/range
longcandle= (ratio>0.6)
bodytop=max(open, close)
bodybottom=min(open, close)
shadowtop=high-bodytop
shadowbottom=bodybottom-low

//Doji
DojiSize = input(0.05, minval=0.01, title="Doji size")
data=(abs(open - close) <= (high - low) * DojiSize)
plotchar(data, title="Doji", text='Doji', color=black)

//BULLISH SIGNALS
//Homing Pigeon
HomingPigeon=(body[1]<0 and body<0 and longcandle[1] and bodybottom>bodybottom[1] and bodytop<bodytop[1])
plotshape(HomingPigeon, title= "Homing Pigeon", location=location.belowbar, color=lime, style=shape.arrowup, text="Homing\nPigeon")

//Dragonfly Doji Bottom
DragonflyDojiBottom=(body[1]<0 and longcandle[1] and low<low[1] and shadowbottom>3*abody and shadowtop<shadowbottom/3)
plotshape(DragonflyDojiBottom, title= "Dragonfly Doji Bottom", location=location.belowbar, color=lime, style=shape.arrowup, text="Dragonfly\nDoji\nBottom")

//Concealing Baby Swallow
ConcealingBabySwallow=(body[3]<0 and body[2]<0 and body[1]<0 and body<0 and ratio[3]>0.8 and ratio[2]>0.8 and ratio>0.8 and open[1]<close[2] and high[1]>close[2] and shadowtop[1]>0.6*(abody[1]+shadowbottom[1]) and bodybottom<bodybottom[1] and bodytop>high[1])
plotshape(ConcealingBabySwallow, title= "Concealing Baby Swallow", location=location.belowbar, color=lime, style=shape.arrowup, text="Concealing\nBaby\nSwallow")

//Gravestone Doji Bottom
GravestoneDojiBottom=(body[1]<0 and longcandle[1] and low<low[1] and shadowtop>3*abody and shadowbottom<shadowtop/3)
plotshape(GravestoneDojiBottom, title= "Gravestone Doji Bottom", location=location.belowbar, color=lime, style=shape.arrowup, text="Gravestone\nDoji\nBottom")

//Last Engulfing Bottom
LastEngulfingBottom=(body[1]>0 and body<0 and bodybottom<bodybottom[1] and bodytop>bodytop[1] and longcandle)
plotshape(LastEngulfingBottom, title= "Last Engulfing Bottom", location=location.belowbar, color=lime, style=shape.arrowup, text="Last\nEngulfing\nBottom")

//Bullish Harami Cross
BullishHaramiCross=(body[1]<0 and longcandle[1] and bodybottom>bodybottom[1] and bodytop<bodytop[1] and ratio<0.3 and range<0.3*range[1])
plotshape(BullishHaramiCross, title= "Bullish Harami Cross", location=location.belowbar, color=lime, style=shape.arrowup, text="Bullish\nHarami\nCross")

//Three Stars in the South
ThreeStarsInTheSouth=(body[2]<0 and body[1]<0 and body<0 and shadowtop[2]<range[2]/4 and shadowbottom[2]>abody[2]/2 and low[1]>low[2] and high[1]<high[2] and abody[1]<abody[2]  and shadowtop[1]<range[1]/4 and shadowbottom[1]>abody[1]/2 and low>low[1] and high<high[1] and abody<abody[1] and shadowtop<range/4 and shadowbottom<range/4)
plotshape(ThreeStarsInTheSouth, title= "Three Stars In TheSouth", location=location.belowbar, color=lime, style=shape.arrowup, text="Three\nStars\nIn\nThe\nSouth")

//Bullish Breakaway
BullishBreakaway=(body[4]<0 and body[3]<0 and body>0 and open[3]<close[4] and close[2]<close[3] and close[1]<close[2] and longcandle and close<close[4] and close>open[3])
plotshape(BullishBreakaway, title= "Bullish Breakaway", location=location.belowbar, color=lime, style=shape.arrowup, text="Bullish\nBreakaway")

//Hammer
Hammer=(body[1]<0 and longcandle[1] and low<low[1] and shadowbottom>2*abody and shadowtop<0.3*abody)
plotshape(Hammer, title= "Hammer", location=location.belowbar, color=lime, style=shape.arrowup, text="Hammer")

//Inverted Hammer
InvertedHammer=(body[1]<0 and longcandle[1] and low<low[1] and shadowtop>2*abody and shadowbottom<0.3*abody)
plotshape(InvertedHammer, title= "Inverted Hammer", location=location.belowbar, color=lime, style=shape.arrowup, text="Inverted\nHammer")

//Rising Three Methods
RisingThreeMethods=(body[4]>0 and body[3]<0 and body[1]<0 and body>0 and longcandle[4] and longcandle and close[2]<close[3] and close[1]<close[2] and high[2]<high[3] and high[1]<high[2] and low[1]>low[4] and open>close[1] and close>high[4] and close>high[3] and close>high[2] and close>high[1])
plotshape(RisingThreeMethods, title= "Rising Three Methods", location=location.belowbar, color=lime, style=shape.arrowup, text="Rising\nThree\nMethods")

//BullishThreeLineStrike
BullishThreeLineStrike=(body[3]>0 and body[2]>0 and body[1]>0 and body<0 and longcandle[3] and longcandle[2] and longcandle[1] and close[2]>close[3] and close[1]>close[2] and open>close[1] and close<open[3])
plotshape(BullishThreeLineStrike, title= "Bullish Three Line Strike", location=location.belowbar, color=lime, style=shape.arrowup, text="Bullish\nThreeLine\nStrike")

//Bullish Mat Hold
BullishMatHold=(body[4]>0 and body[3]<0 and body[1]<0 and body>0 and longcandle[4] and close[3]>close[4] and close[2]<close[3] and close[1]<close[2] and high[2]<high[3] and high[1]<high[2] and low[1]>low[4] and open>close[1] and close>high[4] and  close>high[3] and close>high[2] and close>high[1])
plotshape(BullishMatHold, title= "Bullish Mat Hold", location=location.belowbar, color=lime, style=shape.arrowup, text="Bullish\nMat\nHold")

//Doji Star Bottom
DojiStarBottom=(body[1]<0 and longcandle[1] and low<low[1] and open<close[1] and ratio<0.3 and range<0.3*range[1])
plotshape(DojiStarBottom, title= "Doji Star Bottom", location=location.belowbar, color=lime, style=shape.arrowup, text="Doji\nStar\nBottom")

//Morning Star
MorningStar=(body[2]<0 and body>0 and longcandle[2] and open[1]<close[2] and open>close[1] and ratio[1]<0.3 and abody[1]<abody[2] and abody[1]<abody and low[1]<low and low[1]<low[2] and high[1]<open[2] and high[1]<close)
plotshape(MorningStar,  title= "Morning Star", location=location.belowbar, color=lime, style=shape.arrowup, text="Morning\nStar")

//Abandoned Baby Bottom
AbandonedBabyBottom=(body[2]<0 and body>0 and longcandle[2] and ratio[1]<0.3 and high[1]<low[2] and high[1]<low)
plotshape(AbandonedBabyBottom,  title= "Abandoned Baby Bottom", location=location.belowbar, color=lime, style=shape.arrowup, text="Abandoned\nBaby\nBottom")

//Bullish Harami
BullishHarami=(body[1]<0 and body>0 and longcandle[1] and bodybottom>bodybottom[1] and bodytop<bodytop[1])
plotshape(BullishHarami,  title= "Bullish Harami", location=location.belowbar, color=lime, style=shape.arrowup, text="Bullish\nHarami")

//Three Inside Up
ThreeInsideUp=(body[2]<0 and body[1]>0 and body>0 and BullishHarami[1] and close>close[1])
plotshape(ThreeInsideUp,  title= "Three Inside Up", location=location.belowbar, color=lime, style=shape.arrowup, text="Three\nInside\nUp")

//Bullish Engulfing
BullishEngulfing=(body[1]<0 and body>0 and bodybottom<bodybottom[1] and bodytop>bodytop[1] and longcandle)
plotshape(BullishEngulfing, title= "Bullish Engulfing", location=location.belowbar, color=lime, style=shape.arrowup, text="Bullish\nEngulfing")

//Piercing Line
PiercingLine=(body[1]<0 and body>0 and longcandle[1] and longcandle and open<low[1] and close>middle[1] and close<open[1])
plotshape(PiercingLine, title= "Piercing Line", location=location.belowbar, color=lime, style=shape.arrowup, text="Piercing\nLine")

//Three Outside Up
ThreeOutsideUp=(body[2]<0 and body[1]>0 and body>0 and BullishEngulfing[1] and close>close[1])
plotshape(ThreeOutsideUp, title= "Three Outside Up", location=location.belowbar, color=lime, style=shape.arrowup, text="Three\nOutside\nUp")

//Three White Soldiers
ThreeWhiteSoldiers=(body[2]>0 and body[1]>0 and body>0 and high[1]>high[2] and high>high[1] and close[1]>close[2] and close>close[1] and open[1]>open[2] and open[1]<close[2] and open>open[1] and open<close[1])
plotshape(ThreeWhiteSoldiers, title= "Three White Soldiers", location=location.belowbar, color=lime, style=shape.arrowup, text="Three\nWhite\nSoldiers")

//BEARISH SIGNALS

//Evening Star
EveningStar=(body[2]>0 and body<0 and longcandle[2] and open[1]>close[2] and open<close[1] and ratio[1]<0.3 and abody[1]<abody[2] and abody[1]<abody and high[1]>high and high[1]>high[2] and low[1]>open[2] and low[1]>close)
plotshape(EveningStar, title= "Evening Star", color=red, style=shape.arrowdown, text="Evening\nStar")

//Dark Cloud Cover
DarkCloudCover=(body[1]>0 and body<0 and longcandle[1] and longcandle and open>high[1] and close<middle[1] and close>open[1])
plotshape(DarkCloudCover, title= "Dark Cloud Cover", color=red, style=shape.arrowdown, text="Dark\nCloud\nCover")

//Abandoned Baby Top
AbandonedBabyTop=(body[2]>0 and body<0 and longcandle[2] and ratio[1]<0.3 and low[1]>high[2] and low[1]>high)
plotshape(AbandonedBabyTop, title= "Abandoned Baby Top", color=red, style=shape.arrowdown, text="Abandoned\nBaby\nTop")

//Bearish Harami
BearishHarami=(body[1]>0 and body<0 and longcandle[1] and bodybottom>bodybottom[1] and bodytop<bodytop[1])
plotshape(BearishHarami, title= "Bearish Harami", color=red, style=shape.arrowdown, text="Bearish\nHarami")

//Descending Hawk
DescendingHawk=(body[1]>0 and body>0 and longcandle[1] and bodybottom>bodybottom[1] and bodytop<bodytop[1])
plotshape(DescendingHawk, title= "Descending Hawk", color=red, style=shape.arrowdown, text="Descending\nHawk")

//Bearish Engulfing
BearishEngulfing=(body[1]>0 and body<0 and bodybottom<bodybottom[1] and bodytop>bodytop[1] and longcandle)
plotshape(BearishEngulfing, title= "Bearish Engulfing", color=red, style=shape.arrowdown, text="Bearish\nEngulfing")

//Gravestone Doji Top
GravestoneDojiTop=(body[1]>0 and longcandle[1] and high>high[1] and shadowtop>3*abody and shadowbottom<shadowtop/3)
plotshape(GravestoneDojiTop, title= "Gravestone Doji Top", color=red, style=shape.arrowdown, text="Gravestone\nDoji\nTop")

//Shooting Star
ShootingStar=(body[1]>0 and longcandle[1] and high>high[1] and shadowtop>2*abody and shadowbottom<0.3*abody)
plotshape(ShootingStar, title= "Shooting Star", color=red, style=shape.arrowdown, text="Shooting\nStar")

//Hanging Man
HangingMan=(body[1]>0 and longcandle[1] and high>high[1] and shadowbottom>2*abody and shadowtop<0.3*abody)
plotshape(HangingMan, title= "Hanging Man", color=red, style=shape.arrowdown, text="Hanging\nMan")

//Bearish Three Line Strike
BearishThreeLineStrike=(body[3]<0 and body[2]<0 and body[1]<0 and body>0 and longcandle[3] and longcandle[2] and longcandle[1] and close[2]<close[3] and close[1]<close[2] and open<close[1] and close>open[3])
plotshape(BearishThreeLineStrike, title= "Bearish Three Line Strike", color=red, style=shape.arrowdown, text="Bearish\nThree\nLine\nStrike")

//Falling Three Methods
FallingThreeMethods=(body[4]<0 and body[3]>0 and body[1]>0 and body<0 and longcandle[4] and longcandle and close[2]>close[3] and close[1]>close[2] and low[2]>low[3] and low[1]>low[2] and high[1]<high[4] and open<close[1] and close<low[4] and close<low[3] and close<low[2] and close<low[1])
plotshape(FallingThreeMethods, title= "Falling Three Methods", color=red, style=shape.arrowdown, text="Falling\n\nThreeMethods")

//Three Inside Down
ThreeInsideDown=(body[2]>0 and body[1]<0 and body<0 and BearishHarami[1] and close<close[1])
plotshape(ThreeInsideDown, title= "Three Inside Down", color=red, style=shape.arrowdown, text="Three\nInside\nDown")

//Three Outside Down
ThreeOutsideDown=(body[2]>0 and body[1]<0 and body<0 and BearishEngulfing[1] and close<close[1])
plotshape(ThreeOutsideDown, title= "Three Outside Down", color=red, style=shape.arrowdown, text="Three\nOutside\nDown")

//Three Black Crows
ThreeBlackCrows=(body[2]<0 and body[1]<0 and body<0 and longcandle[2] and longcandle[1] and longcandle and low[1]<low[2] and low<low[1] and close[1]<close[2] and close<close[1] and open[1]<open[2] and open[1]>close[2] and open<open[1] and open>close[1])
plotshape(ThreeBlackCrows, title= "Three Black Crows", color=red, style=shape.arrowdown, text="Three\nBlack\nCrows")

//Upside Gap Two Crows
UpsideGapTwoCrows=(body[2]>0 and body[1]<0 and body<0 and longcandle[2] and open[1]>close[2] and bodytop>bodytop[1] and bodybottom<bodybottom[1] and close>close[2])
plotshape(UpsideGapTwoCrows, title= "Upside Gap Two Crows", color=red, style=shape.arrowdown, text="Upside\nGap\nTwo\nCrows")

//Last Engulfing Top
LastEngulfingTop=(body[1]<0 and body>0 and bodybottom<bodybottom[1] and bodytop>bodytop[1] and longcandle)
plotshape(LastEngulfingTop, title= "Last Engulfing Top", color=red, style=shape.arrowdown, text="Last\nEngulfing\nTop")

//Dragonfly Doji Top
DragonflyDojiTop=(body[1]>0 and longcandle[1] and high>high[1] and shadowbottom>3*abody and shadowtop<shadowbottom/3)
plotshape(DragonflyDojiTop, title= "Dragonfly Doji Top", color=red, style=shape.arrowdown, text="Dragonfly\nDoji\nTop")

//Bearish Harami Cross
BearishHaramiCross=(body[1]>0 and longcandle[1] and bodybottom>bodybottom[1] and bodytop<bodytop[1] and ratio<0.3 and range<0.3*range[1])
plotshape(BearishHaramiCross, title= "Bearish Harami Cross", color=red, style=shape.arrowdown, text="Bearish\nHarami\nCross")

//Advance Block
AdvanceBlock=(body[2]>0 and body[1]>0 and body>0 and high[2]<high[1] and high[1]<high and open[1]>bodybottom[2] and open[1]<bodytop[2] and open>bodybottom[1] and open<bodytop[1] and abody[1]<abody[2] and abody<abody[1])
plotshape(AdvanceBlock, title= "Advance Block", color=red, style=shape.arrowdown, text="Advance\nBlock")

//Bearish Breakaway
BearishBreakaway=(body[4]>0 and body[3]>0 and body<0 and open[3]>close[4] and close[2]>close[3] and close[1]>close[2] and longcandle and close>close[4] and close<open[3])
plotshape(BearishBreakaway, title= "Bearish Breakaway", color=red, style=shape.arrowdown, text="Bearish\nBreakaway")

//Two Crows

TwoCrows=(body[2]>0 and body[1]<0 and body<0 and longcandle[2] and open[1]>close[2] and close[1]>close[2] and open<bodytop[1] and open>bodybottom[1] and close<bodytop[2] and close>bodybottom[2])
plotshape(TwoCrows, title= "Two Crows", color=red, style=shape.arrowdown, text="Two\nCrows")


// === BACKTEST RANGE ===
FromMonth = input(defval = 1, title = "From Month", minval = 1)
FromDay   = input(defval = 1, title = "From Day", minval = 1)
FromYear  = input(defval = 2016, title = "From Year", minval = 2016)
ToMonth   = input(defval = 1, title = "To Month", minval = 1)
ToDay     = input(defval = 1, title = "To Day", minval = 1)
ToYear    = input(defval = 9999, title = "To Year", minval = 9999)

enter_fast = input(20, minval=1)
exit_fast = input(10, minval=1)
exit_fast_short=input(10,minval=1)


fastL = highest(close, enter_fast)
fastS = highest(close ,exit_fast_short)
fastLC = lowest(close, exit_fast)


//entrées et sorties pour long et short, le short utilise la sortie du long comme entrée
enterL1 = close > fastL[1]
exitL1 = close <= fastLC[1]
exitS=close>fastS[1]


strategy.entry("Long", strategy.long, when = enterL1 )
strategy.close("Long", when = exitL1)

strategy.entry("Short", strategy.short, when = exitL1)
strategy.close("Short", when = exitS)