Patrones de velas en el trading cuantitativo y estrategias de seguimiento de tendencias
Descripción general
Esta estrategia se llama “La estrategia de seguimiento de tendencias y la trayectoria de la trayectoria de la trayectoria de la trayectoria de la trayectoria de la trayectoria de la trayectoria de la trayectoria de la trayectoria”.
La estrategia se basa en la identificación de las diferentes formas de la barra, para juzgar la situación actual de la bolsa y los posibles puntos de inflexión. En combinación con el seguimiento de los precios más altos y más bajos, se forman señales de entrada y salida para capturar la tendencia de precios de la línea media larga.
Principio de estrategia
La estrategia se divide en los siguientes módulos:
- El juicio de la forma
La estrategia define primero los elementos en el cuerpo de la antena, como entidades, líneas de sombra, etc., y establece algunos parámetros para identificar más de 40 formas de antena comunes, como estrellas cruzadas, estrellas encendiendo, tres ascensores internos, etc. Cuando se identifican estas formas, se etiquetan y se juzgan como señales de cabezas múltiples o cabezas vacías.
- Juzgar las tendencias
La estrategia utiliza el seguimiento de los precios más altos y más bajos para determinar la tendencia. Se considera una tendencia alcista cuando el precio supera el precio más alto en N días y una tendencia vertical cuando el precio cae por debajo del precio más bajo en N días.
- Entrada y salida
Las señales plurivalentes, combinadas con las rupturas de los precios más altos y más bajos en la determinación de la tendencia, forman las reglas de entrada y salida.
Por ejemplo, cuando se reconoce una forma de tramo múltiple como una línea de conejo, y el precio supera el máximo de N días, se hace más; cuando el precio cae por debajo del mínimo de N días, se elimina más.
- Ajustes de alcance de detección
Finalmente, la estrategia completa el ciclo de cierre de toda la lógica de la estrategia mediante el ajuste de la hora de inicio y finalización de la retroalimentación.
Análisis de las ventajas
La estrategia tiene las siguientes ventajas:
- Combinación de formas y tendencias
Utilizando las ventajas de la combinación de la determinación de la forma y el seguimiento de la tendencia, se puede determinar el posible punto de inflexión del precio a través de la forma y también se puede determinar el momento de entrada a través de la tendencia.
- Identificación en varias formas
Las estrategias incluyen la identificación de más de 40 formas comunes de la pirámide, una amplia cobertura, y la identificación de más oportunidades potenciales de negociación en diferentes entornos de mercado.
- Alta capacidad de ajuste de parámetros
Los parámetros de la estrategia, como el número de días de seguimiento y la identificación de formas, se pueden ajustar de forma autónoma, son adaptables y son más fáciles de ajustar para un mercado específico.
- Se puede ampliar fácilmente
Se pueden ampliar más módulos de reconocimiento de formas directamente en la lógica existente, o se pueden agregar más módulos de determinación de factores para continuar optimizando el efecto de la estrategia.
Análisis de riesgos
La estrategia también tiene los siguientes riesgos:
- El reconocimiento de formas no alcanza el 100%
El juicio de la forma de la cuña no es completamente exacto, todavía existe cierta probabilidad de error de identificación, puede haber casos en que la señal de negociación se haya disparado erróneamente.
- Falta de módulo de deterioro
La estrategia actual no tiene una lógica de stop loss y no puede controlar eficazmente las pérdidas individuales. Cuando la tendencia falla, puede generar grandes pérdidas en la cuenta.
- Riesgo de coincidencia de datos de retroalimentación
El efecto de la estrategia actual puede tener una cierta adaptación a los datos dentro del intervalo de respuestas, y el rendimiento en el disco real puede disminuir.
Dirección de optimización
Las principales direcciones de optimización de la estrategia son las siguientes:
- Añadir módulos de detención de pérdidas
Aumentar las estrategias de detención de pérdidas, como el stop loss móvil y el stop loss porcentual, puede controlar el riesgo de manera efectiva y limitar la pérdida máxima individual.
- Aprendizaje automático para mejorar la precisión de las formas
El uso de algoritmos de aprendizaje automático para entrenar modelos, mejora la precisión de la determinación de la forma de la horquilla y reduce la tasa de señales erróneas.
- Verificación en varios mercados
Prueba de robustez de la estrategia en más mercados, como el mercado de divisas y monedas digitales, para evitar la coincidencia de los datos de retroalimentación.
- Combinación de más factores
Se pueden introducir más factores cuantitativos, como indicadores de precios cuantitativos, indicadores de flujo de capital, etc., para enriquecer la lógica de la estrategia y mejorar la estabilidad.
Resumir
En general, esta estrategia, combinada con el juicio de la tortuosidad y el seguimiento de la tendencia de las transacciones, puede capturar las tendencias de los precios al mismo tiempo que se determina el punto de inflexión del mercado, para lograr ganancias adicionales. El espacio de optimización de la estrategia es grande, y se puede mejorar desde el control del riesgo, el aprendizaje automático, los múltiples factores, etc., lo que hace que la estrategia sea más robusta y de valor comercial.
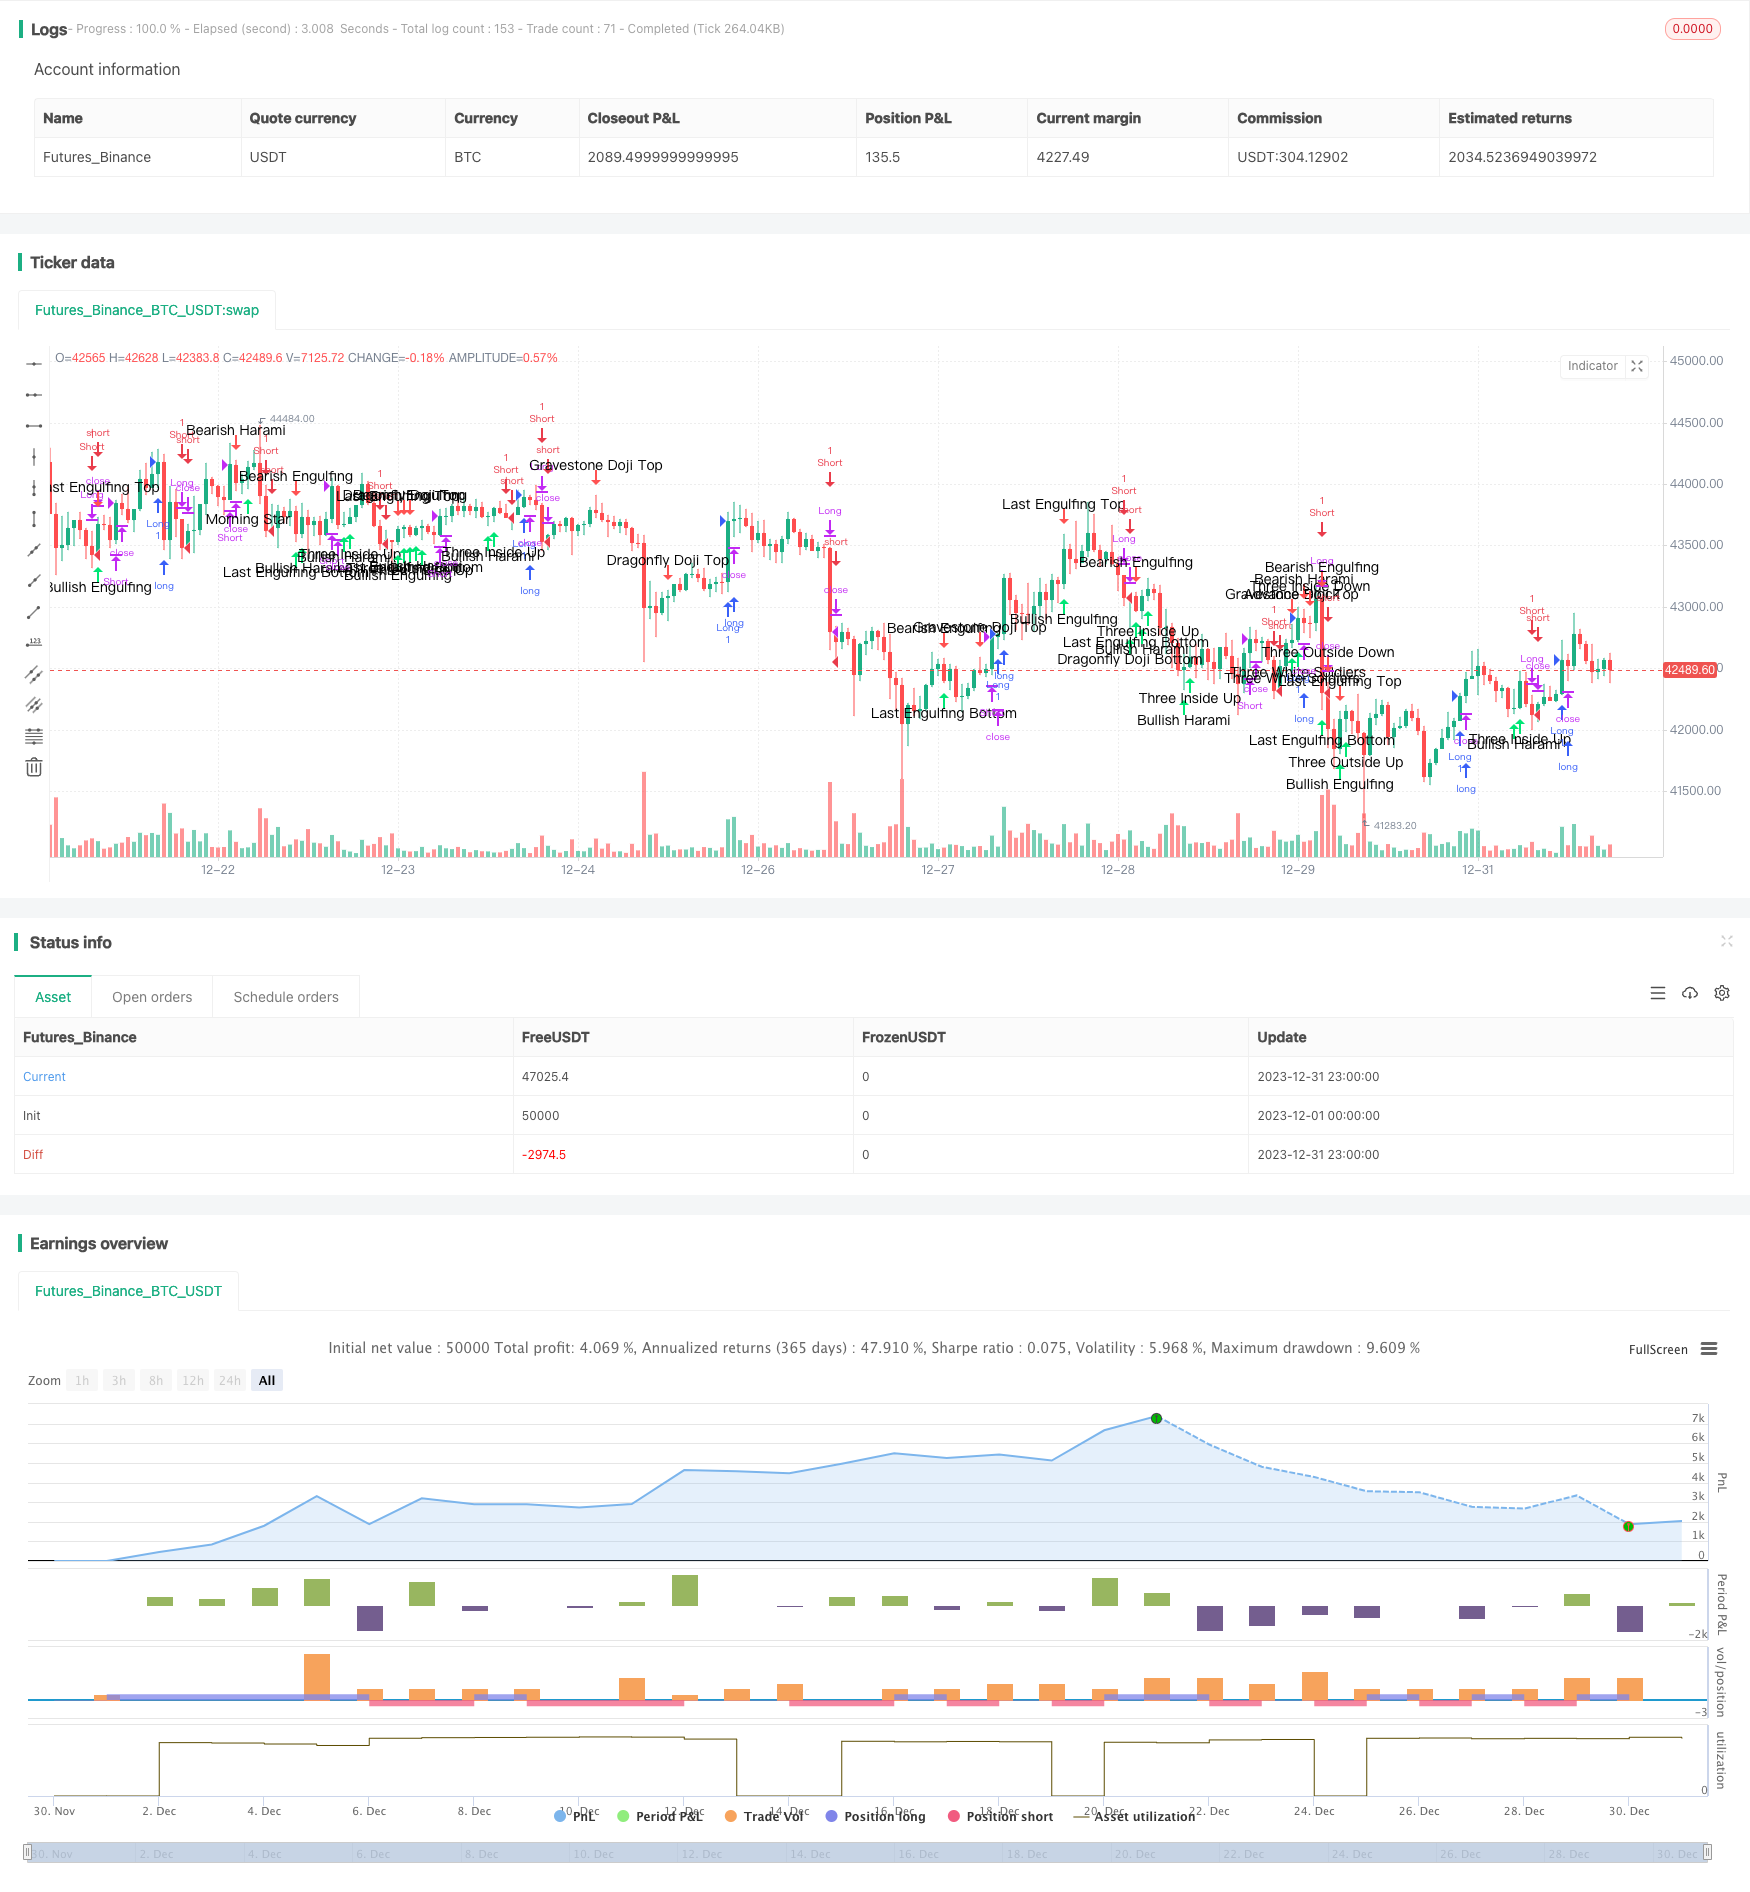
/*backtest
start: 2023-12-01 00:00:00
end: 2023-12-31 23:59:59
period: 1h
basePeriod: 15m
exchanges: [{"eid":"Futures_Binance","currency":"BTC_USDT"}]
*/

//@version=3
strategy("Candle analysis & long/short strategy (HF) inspired by TurtleBC", shorttitle="TurtleBC-V.Troussel", overlay=true,initial_capital=1000)

//VARIABLES
body=close-open
range=high-low
middle=(open+close)/2
abody=abs(body)
ratio=abody/range
longcandle= (ratio>0.6)
bodytop=max(open, close)
bodybottom=min(open, close)
shadowtop=high-bodytop
shadowbottom=bodybottom-low

//Doji
DojiSize = input(0.05, minval=0.01, title="Doji size")
data=(abs(open - close) <= (high - low) * DojiSize)
plotchar(data, title="Doji", text='Doji', color=black)

//BULLISH SIGNALS
//Homing Pigeon
HomingPigeon=(body[1]<0 and body<0 and longcandle[1] and bodybottom>bodybottom[1] and bodytop<bodytop[1])
plotshape(HomingPigeon, title= "Homing Pigeon", location=location.belowbar, color=lime, style=shape.arrowup, text="Homing\nPigeon")

//Dragonfly Doji Bottom
DragonflyDojiBottom=(body[1]<0 and longcandle[1] and low<low[1] and shadowbottom>3*abody and shadowtop<shadowbottom/3)
plotshape(DragonflyDojiBottom, title= "Dragonfly Doji Bottom", location=location.belowbar, color=lime, style=shape.arrowup, text="Dragonfly\nDoji\nBottom")

//Concealing Baby Swallow
ConcealingBabySwallow=(body[3]<0 and body[2]<0 and body[1]<0 and body<0 and ratio[3]>0.8 and ratio[2]>0.8 and ratio>0.8 and open[1]<close[2] and high[1]>close[2] and shadowtop[1]>0.6*(abody[1]+shadowbottom[1]) and bodybottom<bodybottom[1] and bodytop>high[1])
plotshape(ConcealingBabySwallow, title= "Concealing Baby Swallow", location=location.belowbar, color=lime, style=shape.arrowup, text="Concealing\nBaby\nSwallow")

//Gravestone Doji Bottom
GravestoneDojiBottom=(body[1]<0 and longcandle[1] and low<low[1] and shadowtop>3*abody and shadowbottom<shadowtop/3)
plotshape(GravestoneDojiBottom, title= "Gravestone Doji Bottom", location=location.belowbar, color=lime, style=shape.arrowup, text="Gravestone\nDoji\nBottom")

//Last Engulfing Bottom
LastEngulfingBottom=(body[1]>0 and body<0 and bodybottom<bodybottom[1] and bodytop>bodytop[1] and longcandle)
plotshape(LastEngulfingBottom, title= "Last Engulfing Bottom", location=location.belowbar, color=lime, style=shape.arrowup, text="Last\nEngulfing\nBottom")

//Bullish Harami Cross
BullishHaramiCross=(body[1]<0 and longcandle[1] and bodybottom>bodybottom[1] and bodytop<bodytop[1] and ratio<0.3 and range<0.3*range[1])
plotshape(BullishHaramiCross, title= "Bullish Harami Cross", location=location.belowbar, color=lime, style=shape.arrowup, text="Bullish\nHarami\nCross")

//Three Stars in the South
ThreeStarsInTheSouth=(body[2]<0 and body[1]<0 and body<0 and shadowtop[2]<range[2]/4 and shadowbottom[2]>abody[2]/2 and low[1]>low[2] and high[1]<high[2] and abody[1]<abody[2]  and shadowtop[1]<range[1]/4 and shadowbottom[1]>abody[1]/2 and low>low[1] and high<high[1] and abody<abody[1] and shadowtop<range/4 and shadowbottom<range/4)
plotshape(ThreeStarsInTheSouth, title= "Three Stars In TheSouth", location=location.belowbar, color=lime, style=shape.arrowup, text="Three\nStars\nIn\nThe\nSouth")

//Bullish Breakaway
BullishBreakaway=(body[4]<0 and body[3]<0 and body>0 and open[3]<close[4] and close[2]<close[3] and close[1]<close[2] and longcandle and close<close[4] and close>open[3])
plotshape(BullishBreakaway, title= "Bullish Breakaway", location=location.belowbar, color=lime, style=shape.arrowup, text="Bullish\nBreakaway")

//Hammer
Hammer=(body[1]<0 and longcandle[1] and low<low[1] and shadowbottom>2*abody and shadowtop<0.3*abody)
plotshape(Hammer, title= "Hammer", location=location.belowbar, color=lime, style=shape.arrowup, text="Hammer")

//Inverted Hammer
InvertedHammer=(body[1]<0 and longcandle[1] and low<low[1] and shadowtop>2*abody and shadowbottom<0.3*abody)
plotshape(InvertedHammer, title= "Inverted Hammer", location=location.belowbar, color=lime, style=shape.arrowup, text="Inverted\nHammer")

//Rising Three Methods
RisingThreeMethods=(body[4]>0 and body[3]<0 and body[1]<0 and body>0 and longcandle[4] and longcandle and close[2]<close[3] and close[1]<close[2] and high[2]<high[3] and high[1]<high[2] and low[1]>low[4] and open>close[1] and close>high[4] and close>high[3] and close>high[2] and close>high[1])
plotshape(RisingThreeMethods, title= "Rising Three Methods", location=location.belowbar, color=lime, style=shape.arrowup, text="Rising\nThree\nMethods")

//BullishThreeLineStrike
BullishThreeLineStrike=(body[3]>0 and body[2]>0 and body[1]>0 and body<0 and longcandle[3] and longcandle[2] and longcandle[1] and close[2]>close[3] and close[1]>close[2] and open>close[1] and close<open[3])
plotshape(BullishThreeLineStrike, title= "Bullish Three Line Strike", location=location.belowbar, color=lime, style=shape.arrowup, text="Bullish\nThreeLine\nStrike")

//Bullish Mat Hold
BullishMatHold=(body[4]>0 and body[3]<0 and body[1]<0 and body>0 and longcandle[4] and close[3]>close[4] and close[2]<close[3] and close[1]<close[2] and high[2]<high[3] and high[1]<high[2] and low[1]>low[4] and open>close[1] and close>high[4] and  close>high[3] and close>high[2] and close>high[1])
plotshape(BullishMatHold, title= "Bullish Mat Hold", location=location.belowbar, color=lime, style=shape.arrowup, text="Bullish\nMat\nHold")

//Doji Star Bottom
DojiStarBottom=(body[1]<0 and longcandle[1] and low<low[1] and open<close[1] and ratio<0.3 and range<0.3*range[1])
plotshape(DojiStarBottom, title= "Doji Star Bottom", location=location.belowbar, color=lime, style=shape.arrowup, text="Doji\nStar\nBottom")

//Morning Star
MorningStar=(body[2]<0 and body>0 and longcandle[2] and open[1]<close[2] and open>close[1] and ratio[1]<0.3 and abody[1]<abody[2] and abody[1]<abody and low[1]<low and low[1]<low[2] and high[1]<open[2] and high[1]<close)
plotshape(MorningStar,  title= "Morning Star", location=location.belowbar, color=lime, style=shape.arrowup, text="Morning\nStar")

//Abandoned Baby Bottom
AbandonedBabyBottom=(body[2]<0 and body>0 and longcandle[2] and ratio[1]<0.3 and high[1]<low[2] and high[1]<low)
plotshape(AbandonedBabyBottom,  title= "Abandoned Baby Bottom", location=location.belowbar, color=lime, style=shape.arrowup, text="Abandoned\nBaby\nBottom")

//Bullish Harami
BullishHarami=(body[1]<0 and body>0 and longcandle[1] and bodybottom>bodybottom[1] and bodytop<bodytop[1])
plotshape(BullishHarami,  title= "Bullish Harami", location=location.belowbar, color=lime, style=shape.arrowup, text="Bullish\nHarami")

//Three Inside Up
ThreeInsideUp=(body[2]<0 and body[1]>0 and body>0 and BullishHarami[1] and close>close[1])
plotshape(ThreeInsideUp,  title= "Three Inside Up", location=location.belowbar, color=lime, style=shape.arrowup, text="Three\nInside\nUp")

//Bullish Engulfing
BullishEngulfing=(body[1]<0 and body>0 and bodybottom<bodybottom[1] and bodytop>bodytop[1] and longcandle)
plotshape(BullishEngulfing, title= "Bullish Engulfing", location=location.belowbar, color=lime, style=shape.arrowup, text="Bullish\nEngulfing")

//Piercing Line
PiercingLine=(body[1]<0 and body>0 and longcandle[1] and longcandle and open<low[1] and close>middle[1] and close<open[1])
plotshape(PiercingLine, title= "Piercing Line", location=location.belowbar, color=lime, style=shape.arrowup, text="Piercing\nLine")

//Three Outside Up
ThreeOutsideUp=(body[2]<0 and body[1]>0 and body>0 and BullishEngulfing[1] and close>close[1])
plotshape(ThreeOutsideUp, title= "Three Outside Up", location=location.belowbar, color=lime, style=shape.arrowup, text="Three\nOutside\nUp")

//Three White Soldiers
ThreeWhiteSoldiers=(body[2]>0 and body[1]>0 and body>0 and high[1]>high[2] and high>high[1] and close[1]>close[2] and close>close[1] and open[1]>open[2] and open[1]<close[2] and open>open[1] and open<close[1])
plotshape(ThreeWhiteSoldiers, title= "Three White Soldiers", location=location.belowbar, color=lime, style=shape.arrowup, text="Three\nWhite\nSoldiers")

//BEARISH SIGNALS

//Evening Star
EveningStar=(body[2]>0 and body<0 and longcandle[2] and open[1]>close[2] and open<close[1] and ratio[1]<0.3 and abody[1]<abody[2] and abody[1]<abody and high[1]>high and high[1]>high[2] and low[1]>open[2] and low[1]>close)
plotshape(EveningStar, title= "Evening Star", color=red, style=shape.arrowdown, text="Evening\nStar")

//Dark Cloud Cover
DarkCloudCover=(body[1]>0 and body<0 and longcandle[1] and longcandle and open>high[1] and close<middle[1] and close>open[1])
plotshape(DarkCloudCover, title= "Dark Cloud Cover", color=red, style=shape.arrowdown, text="Dark\nCloud\nCover")

//Abandoned Baby Top
AbandonedBabyTop=(body[2]>0 and body<0 and longcandle[2] and ratio[1]<0.3 and low[1]>high[2] and low[1]>high)
plotshape(AbandonedBabyTop, title= "Abandoned Baby Top", color=red, style=shape.arrowdown, text="Abandoned\nBaby\nTop")

//Bearish Harami
BearishHarami=(body[1]>0 and body<0 and longcandle[1] and bodybottom>bodybottom[1] and bodytop<bodytop[1])
plotshape(BearishHarami, title= "Bearish Harami", color=red, style=shape.arrowdown, text="Bearish\nHarami")

//Descending Hawk
DescendingHawk=(body[1]>0 and body>0 and longcandle[1] and bodybottom>bodybottom[1] and bodytop<bodytop[1])
plotshape(DescendingHawk, title= "Descending Hawk", color=red, style=shape.arrowdown, text="Descending\nHawk")

//Bearish Engulfing
BearishEngulfing=(body[1]>0 and body<0 and bodybottom<bodybottom[1] and bodytop>bodytop[1] and longcandle)
plotshape(BearishEngulfing, title= "Bearish Engulfing", color=red, style=shape.arrowdown, text="Bearish\nEngulfing")

//Gravestone Doji Top
GravestoneDojiTop=(body[1]>0 and longcandle[1] and high>high[1] and shadowtop>3*abody and shadowbottom<shadowtop/3)
plotshape(GravestoneDojiTop, title= "Gravestone Doji Top", color=red, style=shape.arrowdown, text="Gravestone\nDoji\nTop")

//Shooting Star
ShootingStar=(body[1]>0 and longcandle[1] and high>high[1] and shadowtop>2*abody and shadowbottom<0.3*abody)
plotshape(ShootingStar, title= "Shooting Star", color=red, style=shape.arrowdown, text="Shooting\nStar")

//Hanging Man
HangingMan=(body[1]>0 and longcandle[1] and high>high[1] and shadowbottom>2*abody and shadowtop<0.3*abody)
plotshape(HangingMan, title= "Hanging Man", color=red, style=shape.arrowdown, text="Hanging\nMan")

//Bearish Three Line Strike
BearishThreeLineStrike=(body[3]<0 and body[2]<0 and body[1]<0 and body>0 and longcandle[3] and longcandle[2] and longcandle[1] and close[2]<close[3] and close[1]<close[2] and open<close[1] and close>open[3])
plotshape(BearishThreeLineStrike, title= "Bearish Three Line Strike", color=red, style=shape.arrowdown, text="Bearish\nThree\nLine\nStrike")

//Falling Three Methods
FallingThreeMethods=(body[4]<0 and body[3]>0 and body[1]>0 and body<0 and longcandle[4] and longcandle and close[2]>close[3] and close[1]>close[2] and low[2]>low[3] and low[1]>low[2] and high[1]<high[4] and open<close[1] and close<low[4] and close<low[3] and close<low[2] and close<low[1])
plotshape(FallingThreeMethods, title= "Falling Three Methods", color=red, style=shape.arrowdown, text="Falling\n\nThreeMethods")

//Three Inside Down
ThreeInsideDown=(body[2]>0 and body[1]<0 and body<0 and BearishHarami[1] and close<close[1])
plotshape(ThreeInsideDown, title= "Three Inside Down", color=red, style=shape.arrowdown, text="Three\nInside\nDown")

//Three Outside Down
ThreeOutsideDown=(body[2]>0 and body[1]<0 and body<0 and BearishEngulfing[1] and close<close[1])
plotshape(ThreeOutsideDown, title= "Three Outside Down", color=red, style=shape.arrowdown, text="Three\nOutside\nDown")

//Three Black Crows
ThreeBlackCrows=(body[2]<0 and body[1]<0 and body<0 and longcandle[2] and longcandle[1] and longcandle and low[1]<low[2] and low<low[1] and close[1]<close[2] and close<close[1] and open[1]<open[2] and open[1]>close[2] and open<open[1] and open>close[1])
plotshape(ThreeBlackCrows, title= "Three Black Crows", color=red, style=shape.arrowdown, text="Three\nBlack\nCrows")

//Upside Gap Two Crows
UpsideGapTwoCrows=(body[2]>0 and body[1]<0 and body<0 and longcandle[2] and open[1]>close[2] and bodytop>bodytop[1] and bodybottom<bodybottom[1] and close>close[2])
plotshape(UpsideGapTwoCrows, title= "Upside Gap Two Crows", color=red, style=shape.arrowdown, text="Upside\nGap\nTwo\nCrows")

//Last Engulfing Top
LastEngulfingTop=(body[1]<0 and body>0 and bodybottom<bodybottom[1] and bodytop>bodytop[1] and longcandle)
plotshape(LastEngulfingTop, title= "Last Engulfing Top", color=red, style=shape.arrowdown, text="Last\nEngulfing\nTop")

//Dragonfly Doji Top
DragonflyDojiTop=(body[1]>0 and longcandle[1] and high>high[1] and shadowbottom>3*abody and shadowtop<shadowbottom/3)
plotshape(DragonflyDojiTop, title= "Dragonfly Doji Top", color=red, style=shape.arrowdown, text="Dragonfly\nDoji\nTop")

//Bearish Harami Cross
BearishHaramiCross=(body[1]>0 and longcandle[1] and bodybottom>bodybottom[1] and bodytop<bodytop[1] and ratio<0.3 and range<0.3*range[1])
plotshape(BearishHaramiCross, title= "Bearish Harami Cross", color=red, style=shape.arrowdown, text="Bearish\nHarami\nCross")

//Advance Block
AdvanceBlock=(body[2]>0 and body[1]>0 and body>0 and high[2]<high[1] and high[1]<high and open[1]>bodybottom[2] and open[1]<bodytop[2] and open>bodybottom[1] and open<bodytop[1] and abody[1]<abody[2] and abody<abody[1])
plotshape(AdvanceBlock, title= "Advance Block", color=red, style=shape.arrowdown, text="Advance\nBlock")

//Bearish Breakaway
BearishBreakaway=(body[4]>0 and body[3]>0 and body<0 and open[3]>close[4] and close[2]>close[3] and close[1]>close[2] and longcandle and close>close[4] and close<open[3])
plotshape(BearishBreakaway, title= "Bearish Breakaway", color=red, style=shape.arrowdown, text="Bearish\nBreakaway")

//Two Crows

TwoCrows=(body[2]>0 and body[1]<0 and body<0 and longcandle[2] and open[1]>close[2] and close[1]>close[2] and open<bodytop[1] and open>bodybottom[1] and close<bodytop[2] and close>bodybottom[2])
plotshape(TwoCrows, title= "Two Crows", color=red, style=shape.arrowdown, text="Two\nCrows")


// === BACKTEST RANGE ===
FromMonth = input(defval = 1, title = "From Month", minval = 1)
FromDay   = input(defval = 1, title = "From Day", minval = 1)
FromYear  = input(defval = 2016, title = "From Year", minval = 2016)
ToMonth   = input(defval = 1, title = "To Month", minval = 1)
ToDay     = input(defval = 1, title = "To Day", minval = 1)
ToYear    = input(defval = 9999, title = "To Year", minval = 9999)

enter_fast = input(20, minval=1)
exit_fast = input(10, minval=1)
exit_fast_short=input(10,minval=1)


fastL = highest(close, enter_fast)
fastS = highest(close ,exit_fast_short)
fastLC = lowest(close, exit_fast)


//entrées et sorties pour long et short, le short utilise la sortie du long comme entrée
enterL1 = close > fastL[1]
exitL1 = close <= fastLC[1]
exitS=close>fastS[1]


strategy.entry("Long", strategy.long, when = enterL1 )
strategy.close("Long", when = exitL1)

strategy.entry("Short", strategy.short, when = exitL1)
strategy.close("Short", when = exitS)